
Exhibit 99.2 INVESTOR PRESENTATION March 2021Exhibit 99.2 INVESTOR PRESENTATION March 2021
DISCLAIMER AND FORWARD–LOOKING STATEMENTS DISCLAIMER AND FORWARD LOOKING STATEMENTS This presentation contains proprietary and confidential information of Spire Global, Inc., and the entire content should be considered “Confidential Information.” This presentation is made solely for informational purposes, and no representation or warranty, express or implied, is made by Spire Global, NavSight Holdings, Inc. (“NavSight”) or any of their representatives as to the information contained in these materials or disclosed during any related presentations or discussions. The recipient of this presentation shall keep this presentation and its contents confidential, shall not use this presentation and its contents for any purpose other than as expressly authorized by Spire Global and NavSight and shall be required to return or destroy all copies of this presentation or portions thereof in its possession promptly following request for the return or destruction of such copies. By accepting delivery of this presentation, the recipient is deemed to agree to the foregoing confidentiality requirements. This presentation is provided for informational purposes only and has been prepared to assist interested parties in making their own evaluation with respect to a potential business combination (the “proposed business combination”) between Spire Global and NavSight and related transactions and for no other purpose. No representations or warranties, express or implied are given in, or in respect of, this presentation. To the fullest extent permitted by law in no circumstances will Spire Global, NavSight or any of their respective subsidiaries, stockholders, affiliates, representatives, partners, directors, officers, employees, investment banks, advisers or agents be responsible or liable for any direct, indirect or consequential loss or loss of profit arising from the use of this presentation, its contents, its omissions, reliance on the information contained within it, or on opinions communicated in relation thereto or otherwise arising in connection therewith. Industry and market data used in this presentation have been obtained from third-party industry publications and sources as well as from research reports prepared for other purposes. Neither Spire Global nor NavSight has independently verified the data obtained from these sources and cannot assure you of the data’s accuracy or completeness. This data is subject to change. In addition, this presentation does not purport to be all-inclusive or to contain all of the information that may be required to make a full analysis of Spire Global or the proposed business combination. Viewers of this presentation should each make their own evaluation of Spire Global and of the relevance and adequacy of the information and should make such other investigations as they deem necessary. Any securities shall be offered only to accredited investors in a private placement under the Securities Act of 1933 or another available exemption, and this presentation is intended solely for the purposes of familiarizing such investors with the company. This presentation is not an offer to sell nor does it seek an offer to buy securities in any jurisdiction where the offer or sale is not permitted. To the extent the terms of any potential transaction are included in this presentation, those terms are included for discussion purposes only. This presentation includes “forward-looking statements” within the meaning of the “safe harbor” provisions of the United States Private Securities Litigation Reform Act of 1995. Forward-looking statements may be identified by the use of words such as “estimate,” “plan,” “project,” “forecast,” “intend,” “will,” “expect,” “anticipate,” “believe,” “seek,” “target” or other similar expressions that predict or indicate future events or trends or that are not statements of historical matters. These forward-looking statements include, but are not limited to, statements regarding estimates and forecasts of financial and performance metrics, expectations of achieving and maintaining profitability, projections of total addressable markets, market opportunity and market share, expectations and timing related to product launches, potential benefits of the transaction and the potential success of Spire Global’s market and growth strategies, and expectations related to the terms and timing of the proposed business combination and related transactions. These statements are based on various assumptions, whether or not identified in this presentation, and on the current expectations of Spire Global’s management and are not predictions of actual performance. These forward-looking statements are provided for illustrative purposes only and are not intended to serve as, and must not be relied on by any investor as, a guarantee, an assurance, a prediction or a definitive statement of fact or probability. Actual events and circumstances are difficult or impossible to predict and will differ from assumptions. Many actual events and circumstances are beyond the control of Spire Global and NavSight. These forward-looking statements are subject to a number of risks and uncertainties, including changes in domestic and foreign business, market, financial, political and legal conditions; the failure of the parties to enter into a definitive merger agreement (or the termination thereof) with respect to the proposed business combination of Spire Global and NavSight; the inability of the parties to successfully or timely consummate the proposed business combination, including the risk that any required regulatory approvals are not obtained, are delayed or are subject to unanticipated conditions that could adversely affect the combined company or the expected benefits of the proposed business combination or that the approval of the stockholders of NavSight or Spire Global is not obtained; failure to realize the anticipated benefits of the proposed business combination; risks relating to the uncertainty of the projected financial information with respect to Spire Global; the effects of competition from existing and future competitors on Spire Global’s future business; technical or other difficulties with our ground stations or satellites; the ability of the company to cost-effectively acquire new customers or obtain renewals; our ability to obtain, protect or enforce our intellectual property and proprietary rights; our ability to comply with the wide range of laws and regulation, and obtain the necessary licenses, to which our business is subject; our ability to maintain our indebtedness and stay in compliance with our credit agreements; and the amount of redemption requests made by NavSight’s public stockholders; the ability of NavSight or the combined company to issue equity or equity-linked securities in connection with the proposed business combination or in the future, and those factors discussed in NavSight’s final prospectus filed on September 9, 2020 under the heading “Risk Factors,” and other documents of NavSight filed, or to be filed, with the Securities and Exchange Commission (“SEC”). If any of these risks materialize or our assumptions prove incorrect, actual results could differ materially from the results implied by these forward-looking statements. There may be additional risks that neither NavSight nor Spire Global presently know or that NavSight and Spire Global currently believe are immaterial that could also cause actual results to differ from those contained in the forward-looking statements. In addition, forward-looking statements reflect NavSight’s and Spire Global’s expectations, plans or forecasts of future events and views as of the date of this presentation. NavSight and Spire Global anticipate that subsequent events and developments will cause NavSight’s and Spire Global’s assessments to change. However, while NavSight and Spire Global may elect to update these forward-looking statements at some point in the future, NavSight and Spire Global specifically disclaim any obligation to do so. These forward-looking statements should not be relied upon as representing NavSight’s and Spire Global’s assessments as of any date subsequent to the date of this presentation. Accordingly, undue reliance should not be placed upon the forward-looking statements. 2DISCLAIMER AND FORWARD–LOOKING STATEMENTS DISCLAIMER AND FORWARD LOOKING STATEMENTS This presentation contains proprietary and confidential information of Spire Global, Inc., and the entire content should be considered “Confidential Information.” This presentation is made solely for informational purposes, and no representation or warranty, express or implied, is made by Spire Global, NavSight Holdings, Inc. (“NavSight”) or any of their representatives as to the information contained in these materials or disclosed during any related presentations or discussions. The recipient of this presentation shall keep this presentation and its contents confidential, shall not use this presentation and its contents for any purpose other than as expressly authorized by Spire Global and NavSight and shall be required to return or destroy all copies of this presentation or portions thereof in its possession promptly following request for the return or destruction of such copies. By accepting delivery of this presentation, the recipient is deemed to agree to the foregoing confidentiality requirements. This presentation is provided for informational purposes only and has been prepared to assist interested parties in making their own evaluation with respect to a potential business combination (the “proposed business combination”) between Spire Global and NavSight and related transactions and for no other purpose. No representations or warranties, express or implied are given in, or in respect of, this presentation. To the fullest extent permitted by law in no circumstances will Spire Global, NavSight or any of their respective subsidiaries, stockholders, affiliates, representatives, partners, directors, officers, employees, investment banks, advisers or agents be responsible or liable for any direct, indirect or consequential loss or loss of profit arising from the use of this presentation, its contents, its omissions, reliance on the information contained within it, or on opinions communicated in relation thereto or otherwise arising in connection therewith. Industry and market data used in this presentation have been obtained from third-party industry publications and sources as well as from research reports prepared for other purposes. Neither Spire Global nor NavSight has independently verified the data obtained from these sources and cannot assure you of the data’s accuracy or completeness. This data is subject to change. In addition, this presentation does not purport to be all-inclusive or to contain all of the information that may be required to make a full analysis of Spire Global or the proposed business combination. Viewers of this presentation should each make their own evaluation of Spire Global and of the relevance and adequacy of the information and should make such other investigations as they deem necessary. Any securities shall be offered only to accredited investors in a private placement under the Securities Act of 1933 or another available exemption, and this presentation is intended solely for the purposes of familiarizing such investors with the company. This presentation is not an offer to sell nor does it seek an offer to buy securities in any jurisdiction where the offer or sale is not permitted. To the extent the terms of any potential transaction are included in this presentation, those terms are included for discussion purposes only. This presentation includes “forward-looking statements” within the meaning of the “safe harbor” provisions of the United States Private Securities Litigation Reform Act of 1995. Forward-looking statements may be identified by the use of words such as “estimate,” “plan,” “project,” “forecast,” “intend,” “will,” “expect,” “anticipate,” “believe,” “seek,” “target” or other similar expressions that predict or indicate future events or trends or that are not statements of historical matters. These forward-looking statements include, but are not limited to, statements regarding estimates and forecasts of financial and performance metrics, expectations of achieving and maintaining profitability, projections of total addressable markets, market opportunity and market share, expectations and timing related to product launches, potential benefits of the transaction and the potential success of Spire Global’s market and growth strategies, and expectations related to the terms and timing of the proposed business combination and related transactions. These statements are based on various assumptions, whether or not identified in this presentation, and on the current expectations of Spire Global’s management and are not predictions of actual performance. These forward-looking statements are provided for illustrative purposes only and are not intended to serve as, and must not be relied on by any investor as, a guarantee, an assurance, a prediction or a definitive statement of fact or probability. Actual events and circumstances are difficult or impossible to predict and will differ from assumptions. Many actual events and circumstances are beyond the control of Spire Global and NavSight. These forward-looking statements are subject to a number of risks and uncertainties, including changes in domestic and foreign business, market, financial, political and legal conditions; the failure of the parties to enter into a definitive merger agreement (or the termination thereof) with respect to the proposed business combination of Spire Global and NavSight; the inability of the parties to successfully or timely consummate the proposed business combination, including the risk that any required regulatory approvals are not obtained, are delayed or are subject to unanticipated conditions that could adversely affect the combined company or the expected benefits of the proposed business combination or that the approval of the stockholders of NavSight or Spire Global is not obtained; failure to realize the anticipated benefits of the proposed business combination; risks relating to the uncertainty of the projected financial information with respect to Spire Global; the effects of competition from existing and future competitors on Spire Global’s future business; technical or other difficulties with our ground stations or satellites; the ability of the company to cost-effectively acquire new customers or obtain renewals; our ability to obtain, protect or enforce our intellectual property and proprietary rights; our ability to comply with the wide range of laws and regulation, and obtain the necessary licenses, to which our business is subject; our ability to maintain our indebtedness and stay in compliance with our credit agreements; and the amount of redemption requests made by NavSight’s public stockholders; the ability of NavSight or the combined company to issue equity or equity-linked securities in connection with the proposed business combination or in the future, and those factors discussed in NavSight’s final prospectus filed on September 9, 2020 under the heading “Risk Factors,” and other documents of NavSight filed, or to be filed, with the Securities and Exchange Commission (“SEC”). If any of these risks materialize or our assumptions prove incorrect, actual results could differ materially from the results implied by these forward-looking statements. There may be additional risks that neither NavSight nor Spire Global presently know or that NavSight and Spire Global currently believe are immaterial that could also cause actual results to differ from those contained in the forward-looking statements. In addition, forward-looking statements reflect NavSight’s and Spire Global’s expectations, plans or forecasts of future events and views as of the date of this presentation. NavSight and Spire Global anticipate that subsequent events and developments will cause NavSight’s and Spire Global’s assessments to change. However, while NavSight and Spire Global may elect to update these forward-looking statements at some point in the future, NavSight and Spire Global specifically disclaim any obligation to do so. These forward-looking statements should not be relied upon as representing NavSight’s and Spire Global’s assessments as of any date subsequent to the date of this presentation. Accordingly, undue reliance should not be placed upon the forward-looking statements. 2
DISCLAIMER AND FORWARD–LOOKING STATEMENTS (CONT’D) DISCLAIMER AND FORWARD LOOKING STATEMENTS This presentation contains projected financial information with respect to Spire Global, namely Annual Recurring Revenue Growth, Customer Net Revenue Retention, Annual Recurring Revenue, Gross Profit and Gross Profit Margin, Free Cash Flow Conversion, Addressable Market, Average Sales Price Growth, Adjusted EBITDA and others. Such projected financial information constitutes forward-looking information, and is for illustrative purposes only and should not be relied upon as necessarily being indicative of future results. The assumptions and estimates underlying such projected financial information are inherently uncertain and are subject to a wide variety of significant business, economic, competitive and other risks and uncertainties that could cause actual results to differ materially from those contained in the prospective financial information. See “Forward-Looking Statements” above. Actual results may differ materially from the results contemplated by the projected financial information contained in this presentation, and the inclusion of such information in this presentation should not be regarded as a representation by any person that the results reflected in such projections will be achieved. Neither the independent auditors of NavSight nor the independent registered public accounting firm of Spire Global, audited, reviewed, compiled, or performed any procedures with respect to the projections for the purpose of their inclusion in this presentation, and accordingly, neither of them expressed an opinion or provided any other form of assurance with respect thereto for the purpose of this presentation. This presentation contains trademarks, service marks, trade names and copyrights of Spire Global, NavSight and other companies, which are the property of their respective owners. The financial information and data contained in this presentation is unaudited and does not conform to Regulation S-X. Accordingly, such information and data may not be included in, may be adjusted in or may be presented differently in, any proxy statement, registration statement, or prospectus to be filed by NavSight with the SEC. Some of the financial information and data contained in this presentation, such as Adjusted EBITDA have not been prepared in accordance with United States generally accepted accounting principles (“GAAP”). NavSight and Spire Global believe these non-GAAP measures of financial results provide useful information to management and investors regarding certain financial and business trends relating to Spire Global’s financial condition and results of operations. NavSight and Spire Global believe that the use of these non-GAAP financial measures provides an additional tool for investors to use in evaluating projected operating results and trends in and in comparing Spire Global’s financial measures with other similar companies, many of which present similar non-GAAP financial measures to investors. Management does not consider these non-GAAP measures in isolation or as an alternative to financial measures determined in accordance with GAAP. The principal limitation of these non-GAAP financial measures is that they exclude significant expenses and income that are required by GAAP to be recorded in Spire Global’s financial statements. In addition, they are subject to inherent limitations as they reflect the exercise of judgments by management about which expense and income are excluded or included in determining these non-GAAP financial measures. Please see the Appendix (page 36) for a reconciliation of Adjusted EBITDA to the most directly comparable GAAP financial measure for the periods presented. You should review Spire Global’s audited financial statements, which will be included in the Proxy Statement (as defined below) relating to the proposed business combination (as described further below). ADDITIONAL INFORMATION ABOUT THE PROPOSED BUSINESS COMBINATION AND WHERE TO FIND IT The proposed business combination will be submitted to stockholders of NavSight for their consideration. NavSight intends to file a proxy statement (the “Proxy Statement”) with the SEC, to be distributed to NavSight’s stockholders in connection with NavSight’s solicitation for proxies for the vote by NavSight’s shareholders in connection with the proposed business combination and other matters as described in the Proxy Statement. After the Proxy Statement has been filed and declared effective, NavSight will mail a definitive proxy statement and other relevant documents to its stockholders as of the record date established for voting on the proposed business combination. NavSight’s stockholders and other interested persons are advised to read, once available, the preliminary proxy statement and any amendments thereto and, once available, the definitive proxy statement, in connection with NavSight’s solicitation of proxies for its special meeting of stockholders to be held to approve, among other things, the proposed business combination, because these documents will contain important information about NavSight, Spire Global and the proposed business combination. Stockholders may also obtain a copy of the preliminary or definitive proxy statement, once available, as well as other documents filed with the SEC regarding the proposed business combination and other documents filed with the SEC by NavSight, without charge, at the SEC’s website located at www.sec.gov or by directing a request to Robert Coleman (phone: (571) 500-2236). INVESTMENT IN ANY SECURITIES DESCRIBED HEREIN HAS NOT BEEN APPROVED OR DISAPPROVED BY THE SEC OR ANY OTHER REGULATORY AUTHORITY NOR HAS ANY AUTHORITY PASSED UPON OR ENDORSED THE MERITS OF THE OFFERING OR THE ACCURACY OR ADEQUACY OF THE INFORMATION CONTAINED HEREIN. ANY REPRESENTATION TO THE CONTRARY IS A CRIMINAL OFFENSE. PARTICIPANTS IN THE SOLICITATION NavSight, Spire Global and certain of their respective directors, executive officers and other members of management and employees may, under SEC rules, be deemed to be participants in the solicitations of proxies from NavSight’s stockholders in connection with the proposed business combination. Information regarding the persons who may, under SEC rules, be deemed participants in the solicitation of NavSight’s stockholders in connection with the proposed business combination will be set forth in NavSight’s proxy statement when it is filed with the SEC. You can find more information about NavSight’s directors and executive officers in NavSight’s final prospectus filed with the SEC on September 9, 2020. Additional information regarding the participants in the proxy solicitation and a description of their direct and indirect interests will be included in NavSight’s proxy statement when it becomes available. Stockholders, potential investors and other interested persons should read the proxy statement carefully when it becomes available before making any voting or investment decisions. You may obtain free copies of these documents from the sources indicated above. 3DISCLAIMER AND FORWARD–LOOKING STATEMENTS (CONT’D) DISCLAIMER AND FORWARD LOOKING STATEMENTS This presentation contains projected financial information with respect to Spire Global, namely Annual Recurring Revenue Growth, Customer Net Revenue Retention, Annual Recurring Revenue, Gross Profit and Gross Profit Margin, Free Cash Flow Conversion, Addressable Market, Average Sales Price Growth, Adjusted EBITDA and others. Such projected financial information constitutes forward-looking information, and is for illustrative purposes only and should not be relied upon as necessarily being indicative of future results. The assumptions and estimates underlying such projected financial information are inherently uncertain and are subject to a wide variety of significant business, economic, competitive and other risks and uncertainties that could cause actual results to differ materially from those contained in the prospective financial information. See “Forward-Looking Statements” above. Actual results may differ materially from the results contemplated by the projected financial information contained in this presentation, and the inclusion of such information in this presentation should not be regarded as a representation by any person that the results reflected in such projections will be achieved. Neither the independent auditors of NavSight nor the independent registered public accounting firm of Spire Global, audited, reviewed, compiled, or performed any procedures with respect to the projections for the purpose of their inclusion in this presentation, and accordingly, neither of them expressed an opinion or provided any other form of assurance with respect thereto for the purpose of this presentation. This presentation contains trademarks, service marks, trade names and copyrights of Spire Global, NavSight and other companies, which are the property of their respective owners. The financial information and data contained in this presentation is unaudited and does not conform to Regulation S-X. Accordingly, such information and data may not be included in, may be adjusted in or may be presented differently in, any proxy statement, registration statement, or prospectus to be filed by NavSight with the SEC. Some of the financial information and data contained in this presentation, such as Adjusted EBITDA have not been prepared in accordance with United States generally accepted accounting principles (“GAAP”). NavSight and Spire Global believe these non-GAAP measures of financial results provide useful information to management and investors regarding certain financial and business trends relating to Spire Global’s financial condition and results of operations. NavSight and Spire Global believe that the use of these non-GAAP financial measures provides an additional tool for investors to use in evaluating projected operating results and trends in and in comparing Spire Global’s financial measures with other similar companies, many of which present similar non-GAAP financial measures to investors. Management does not consider these non-GAAP measures in isolation or as an alternative to financial measures determined in accordance with GAAP. The principal limitation of these non-GAAP financial measures is that they exclude significant expenses and income that are required by GAAP to be recorded in Spire Global’s financial statements. In addition, they are subject to inherent limitations as they reflect the exercise of judgments by management about which expense and income are excluded or included in determining these non-GAAP financial measures. Please see the Appendix (page 36) for a reconciliation of Adjusted EBITDA to the most directly comparable GAAP financial measure for the periods presented. You should review Spire Global’s audited financial statements, which will be included in the Proxy Statement (as defined below) relating to the proposed business combination (as described further below). ADDITIONAL INFORMATION ABOUT THE PROPOSED BUSINESS COMBINATION AND WHERE TO FIND IT The proposed business combination will be submitted to stockholders of NavSight for their consideration. NavSight intends to file a proxy statement (the “Proxy Statement”) with the SEC, to be distributed to NavSight’s stockholders in connection with NavSight’s solicitation for proxies for the vote by NavSight’s shareholders in connection with the proposed business combination and other matters as described in the Proxy Statement. After the Proxy Statement has been filed and declared effective, NavSight will mail a definitive proxy statement and other relevant documents to its stockholders as of the record date established for voting on the proposed business combination. NavSight’s stockholders and other interested persons are advised to read, once available, the preliminary proxy statement and any amendments thereto and, once available, the definitive proxy statement, in connection with NavSight’s solicitation of proxies for its special meeting of stockholders to be held to approve, among other things, the proposed business combination, because these documents will contain important information about NavSight, Spire Global and the proposed business combination. Stockholders may also obtain a copy of the preliminary or definitive proxy statement, once available, as well as other documents filed with the SEC regarding the proposed business combination and other documents filed with the SEC by NavSight, without charge, at the SEC’s website located at www.sec.gov or by directing a request to Robert Coleman (phone: (571) 500-2236). INVESTMENT IN ANY SECURITIES DESCRIBED HEREIN HAS NOT BEEN APPROVED OR DISAPPROVED BY THE SEC OR ANY OTHER REGULATORY AUTHORITY NOR HAS ANY AUTHORITY PASSED UPON OR ENDORSED THE MERITS OF THE OFFERING OR THE ACCURACY OR ADEQUACY OF THE INFORMATION CONTAINED HEREIN. ANY REPRESENTATION TO THE CONTRARY IS A CRIMINAL OFFENSE. PARTICIPANTS IN THE SOLICITATION NavSight, Spire Global and certain of their respective directors, executive officers and other members of management and employees may, under SEC rules, be deemed to be participants in the solicitations of proxies from NavSight’s stockholders in connection with the proposed business combination. Information regarding the persons who may, under SEC rules, be deemed participants in the solicitation of NavSight’s stockholders in connection with the proposed business combination will be set forth in NavSight’s proxy statement when it is filed with the SEC. You can find more information about NavSight’s directors and executive officers in NavSight’s final prospectus filed with the SEC on September 9, 2020. Additional information regarding the participants in the proxy solicitation and a description of their direct and indirect interests will be included in NavSight’s proxy statement when it becomes available. Stockholders, potential investors and other interested persons should read the proxy statement carefully when it becomes available before making any voting or investment decisions. You may obtain free copies of these documents from the sources indicated above. 3
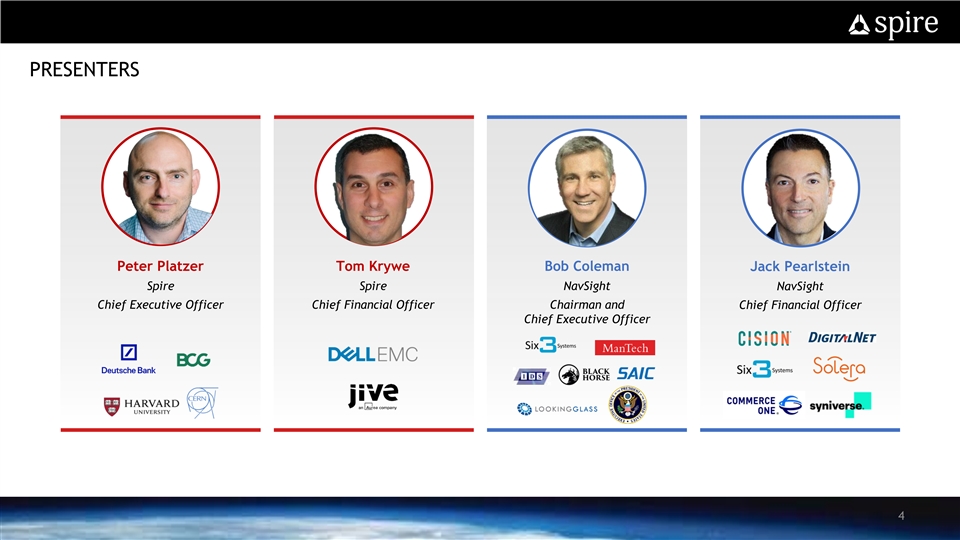
PRESENTERS Peter Platzer Tom Krywe Bob Coleman Jack Pearlstein Spire Spire NavSight NavSight Chief Executive Officer Chief Financial Officer Chairman and Chief Financial Officer Chief Executive Officer 4PRESENTERS Peter Platzer Tom Krywe Bob Coleman Jack Pearlstein Spire Spire NavSight NavSight Chief Executive Officer Chief Financial Officer Chairman and Chief Financial Officer Chief Executive Officer 4
SPIRE KEY INVESTMENT HIGHLIGHTS DISCLAIMER AND FORWARD LOOKING STATEMENTS High Growth SaaS Company, Powered by Proprietary, Space-based Data and Analytics Platform Massive, Rapidly Growing Total Addressable Market Recurring Revenue Model for Predictive Analytics and Data with Exceptional SaaS KPIs Constellation Fully Deployed, Attractive Operating Profile, Clear Path to Profitability Multiple Products across a Range of Industries, Supporting Net Zero and Climate Change Adaptation Exceptional Management Team with Deep Domain Expertise and Staying Power 5SPIRE KEY INVESTMENT HIGHLIGHTS DISCLAIMER AND FORWARD LOOKING STATEMENTS High Growth SaaS Company, Powered by Proprietary, Space-based Data and Analytics Platform Massive, Rapidly Growing Total Addressable Market Recurring Revenue Model for Predictive Analytics and Data with Exceptional SaaS KPIs Constellation Fully Deployed, Attractive Operating Profile, Clear Path to Profitability Multiple Products across a Range of Industries, Supporting Net Zero and Climate Change Adaptation Exceptional Management Team with Deep Domain Expertise and Staying Power 5
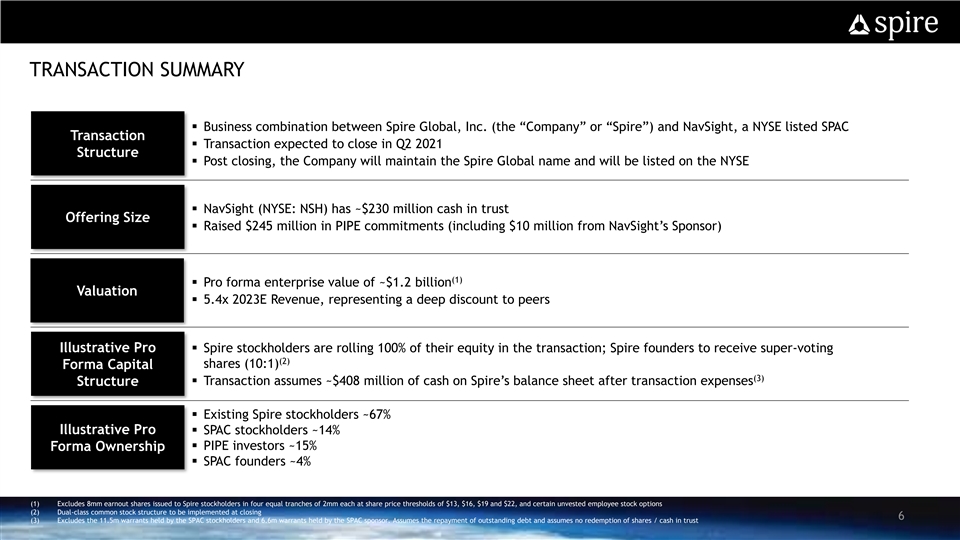
TRANSACTION SUMMARY DISCLAIMER AND FORWARD LOOKING STATEMENTS § Business combination between Spire Global, Inc. (the “Company” or “Spire”) and NavSight, a NYSE listed SPAC Transaction § Transaction expected to close in Q2 2021 Structure § Post closing, the Company will maintain the Spire Global name and will be listed on the NYSE § NavSight (NYSE: NSH) has ~$230 million cash in trust Offering Size § Raised $245 million in PIPE commitments (including $10 million from NavSight’s Sponsor) (1) § Pro forma enterprise value of ~$1.2 billion Valuation § 5.4x 2023E Revenue, representing a deep discount to peers Illustrative Pro § Spire stockholders are rolling 100% of their equity in the transaction; Spire founders to receive super-voting (2) shares (10:1) Forma Capital (3) § Transaction assumes ~$408 million of cash on Spire’s balance sheet after transaction expenses Structure § Existing Spire stockholders ~67% Illustrative Pro § SPAC stockholders ~14% § PIPE investors ~15% Forma Ownership § SPAC founders ~4% (1) Excludes 8mm earnout shares issued to Spire stockholders in four equal tranches of 2mm each at share price thresholds of $13, $16, $19 and $22, and certain unvested employee stock options (2) Dual-class common stock structure to be implemented at closing 6 (3) Excludes the 11.5m warrants held by the SPAC stockholders and 6.6m warrants held by the SPAC sponsor. Assumes the repayment of outstanding debt and assumes no redemption of shares / cash in trustTRANSACTION SUMMARY DISCLAIMER AND FORWARD LOOKING STATEMENTS § Business combination between Spire Global, Inc. (the “Company” or “Spire”) and NavSight, a NYSE listed SPAC Transaction § Transaction expected to close in Q2 2021 Structure § Post closing, the Company will maintain the Spire Global name and will be listed on the NYSE § NavSight (NYSE: NSH) has ~$230 million cash in trust Offering Size § Raised $245 million in PIPE commitments (including $10 million from NavSight’s Sponsor) (1) § Pro forma enterprise value of ~$1.2 billion Valuation § 5.4x 2023E Revenue, representing a deep discount to peers Illustrative Pro § Spire stockholders are rolling 100% of their equity in the transaction; Spire founders to receive super-voting (2) shares (10:1) Forma Capital (3) § Transaction assumes ~$408 million of cash on Spire’s balance sheet after transaction expenses Structure § Existing Spire stockholders ~67% Illustrative Pro § SPAC stockholders ~14% § PIPE investors ~15% Forma Ownership § SPAC founders ~4% (1) Excludes 8mm earnout shares issued to Spire stockholders in four equal tranches of 2mm each at share price thresholds of $13, $16, $19 and $22, and certain unvested employee stock options (2) Dual-class common stock structure to be implemented at closing 6 (3) Excludes the 11.5m warrants held by the SPAC stockholders and 6.6m warrants held by the SPAC sponsor. Assumes the repayment of outstanding debt and assumes no redemption of shares / cash in trust
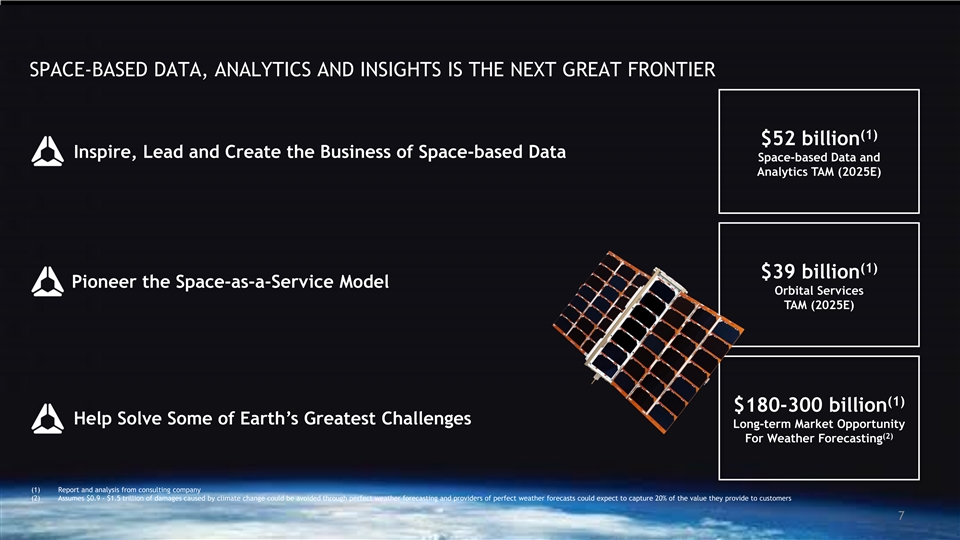
SPACE-BASED DATA, ANALYTICS AND INSIGHTS IS THE NEXT GREAT FRONTIER (1) $52 billion Inspire, Lead and Create the Business of Space-based Data Space-based Data and Analytics TAM (2025E) (1) $39 billion Pioneer the Space-as-a-Service Model Orbital Services TAM (2025E) (1) $180-300 billion Help Solve Some of Earth’s Greatest Challenges Long-term Market Opportunity (2) For Weather Forecasting (1) Report and analysis from consulting company (2) Assumes $0.9 - $1.5 trillion of damages caused by climate change could be avoided through perfect weather forecasting and providers of perfect weather forecasts could expect to capture 20% of the value they provide to customers 7SPACE-BASED DATA, ANALYTICS AND INSIGHTS IS THE NEXT GREAT FRONTIER (1) $52 billion Inspire, Lead and Create the Business of Space-based Data Space-based Data and Analytics TAM (2025E) (1) $39 billion Pioneer the Space-as-a-Service Model Orbital Services TAM (2025E) (1) $180-300 billion Help Solve Some of Earth’s Greatest Challenges Long-term Market Opportunity (2) For Weather Forecasting (1) Report and analysis from consulting company (2) Assumes $0.9 - $1.5 trillion of damages caused by climate change could be avoided through perfect weather forecasting and providers of perfect weather forecasts could expect to capture 20% of the value they provide to customers 7
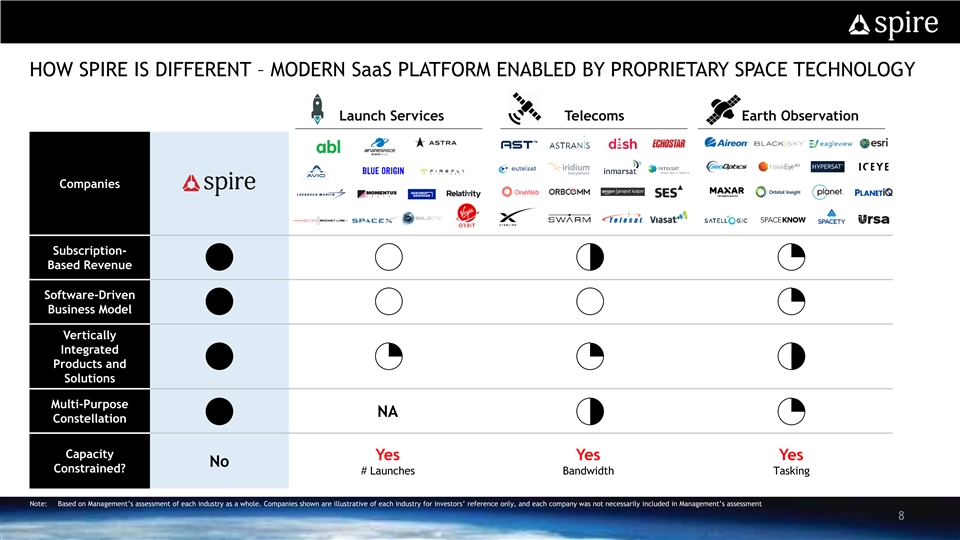
HOW SPIRE IS DIFFERENT – MODERN SaaS PLATFORM ENABLED BY PROPRIETARY SPACE TECHNOLOGY DISCLAIMER AND FORWARD LOOKING STATEMENTS Launch Services Telecoms Earth Observation Companies Subscription- Based Revenue Software-Driven Business Model Vertically Integrated Products and Solutions Multi-Purpose NA Constellation Capacity Yes Yes Yes No Constrained? # Launches Bandwidth Tasking Note: Based on Management’s assessment of each industry as a whole. Companies shown are illustrative of each industry for investors’ reference only, and each company was not necessarily included in Management’s assessment 8HOW SPIRE IS DIFFERENT – MODERN SaaS PLATFORM ENABLED BY PROPRIETARY SPACE TECHNOLOGY DISCLAIMER AND FORWARD LOOKING STATEMENTS Launch Services Telecoms Earth Observation Companies Subscription- Based Revenue Software-Driven Business Model Vertically Integrated Products and Solutions Multi-Purpose NA Constellation Capacity Yes Yes Yes No Constrained? # Launches Bandwidth Tasking Note: Based on Management’s assessment of each industry as a whole. Companies shown are illustrative of each industry for investors’ reference only, and each company was not necessarily included in Management’s assessment 8
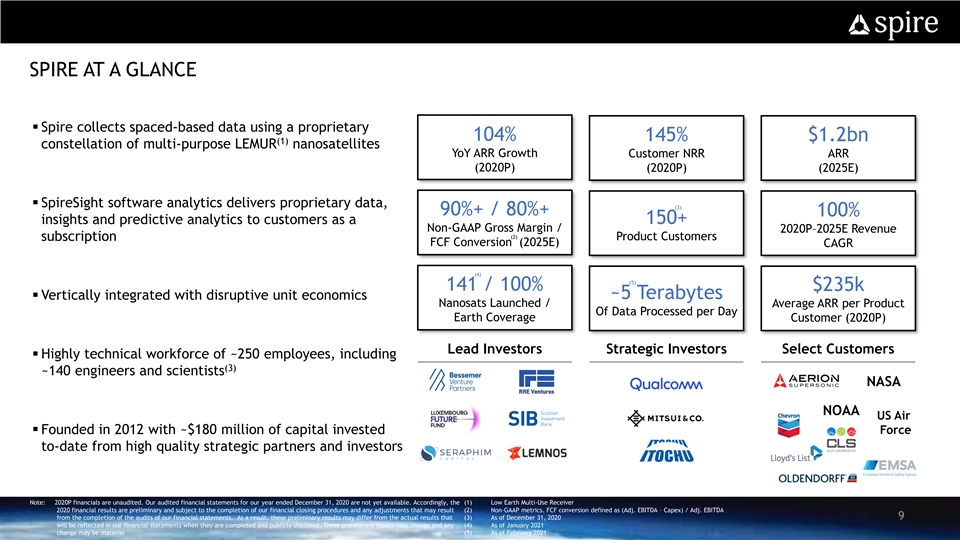
SPIRE AT A GLANCE DISCLAIMER AND FORWARD LOOKING STATEMENTS § Spire collects spaced-based data using a proprietary 104% 145% $1.2bn (1) constellation of multi-purpose LEMUR nanosatellites YoY ARR Growth Customer NRR ARR (2020P) (2020P) (2025E) § SpireSight software analytics delivers proprietary data, (3) 90%+ / 80%+ 100% insights and predictive analytics to customers as a 150+ Non-GAAP Gross Margin / 2020P–2025E Revenue (2) Product Customers subscription FCF Conversion (2025E) CAGR (4) (5) 141 / 100% $235k ~5 Terabytes § Vertically integrated with disruptive unit economics Nanosats Launched / Average ARR per Product Of Data Processed per Day Earth Coverage Customer (2020P) Lead Investors Strategic Investors Select Customers § Highly technical workforce of ~250 employees, including (3) ~140 engineers and scientists NASA NOAA US Air § Founded in 2012 with ~$180 million of capital invested Force to-date from high quality strategic partners and investors Note: 2020P financials are unaudited. Our audited financial statements for our year ended December 31, 2020 are not yet available. Accordingly, the (1) Low Earth Multi-Use Receiver 2020 financial results are preliminary and subject to the completion of our financial closing procedures and any adjustments that may result (2) Non-GAAP metrics. FCF conversion defined as (Adj. EBITDA – Capex) / Adj. EBITDA from the completion of the audits of our financial statements. As a result, these preliminary results may differ from the actual results that (3) As of December 31, 2020 9 will be reflected in our financial statements when they are completed and publicly disclosed. These preliminary results may change and any (4) As of January 2021 change may be material (5) As of February 2021SPIRE AT A GLANCE DISCLAIMER AND FORWARD LOOKING STATEMENTS § Spire collects spaced-based data using a proprietary 104% 145% $1.2bn (1) constellation of multi-purpose LEMUR nanosatellites YoY ARR Growth Customer NRR ARR (2020P) (2020P) (2025E) § SpireSight software analytics delivers proprietary data, (3) 90%+ / 80%+ 100% insights and predictive analytics to customers as a 150+ Non-GAAP Gross Margin / 2020P–2025E Revenue (2) Product Customers subscription FCF Conversion (2025E) CAGR (4) (5) 141 / 100% $235k ~5 Terabytes § Vertically integrated with disruptive unit economics Nanosats Launched / Average ARR per Product Of Data Processed per Day Earth Coverage Customer (2020P) Lead Investors Strategic Investors Select Customers § Highly technical workforce of ~250 employees, including (3) ~140 engineers and scientists NASA NOAA US Air § Founded in 2012 with ~$180 million of capital invested Force to-date from high quality strategic partners and investors Note: 2020P financials are unaudited. Our audited financial statements for our year ended December 31, 2020 are not yet available. Accordingly, the (1) Low Earth Multi-Use Receiver 2020 financial results are preliminary and subject to the completion of our financial closing procedures and any adjustments that may result (2) Non-GAAP metrics. FCF conversion defined as (Adj. EBITDA – Capex) / Adj. EBITDA from the completion of the audits of our financial statements. As a result, these preliminary results may differ from the actual results that (3) As of December 31, 2020 9 will be reflected in our financial statements when they are completed and publicly disclosed. These preliminary results may change and any (4) As of January 2021 change may be material (5) As of February 2021
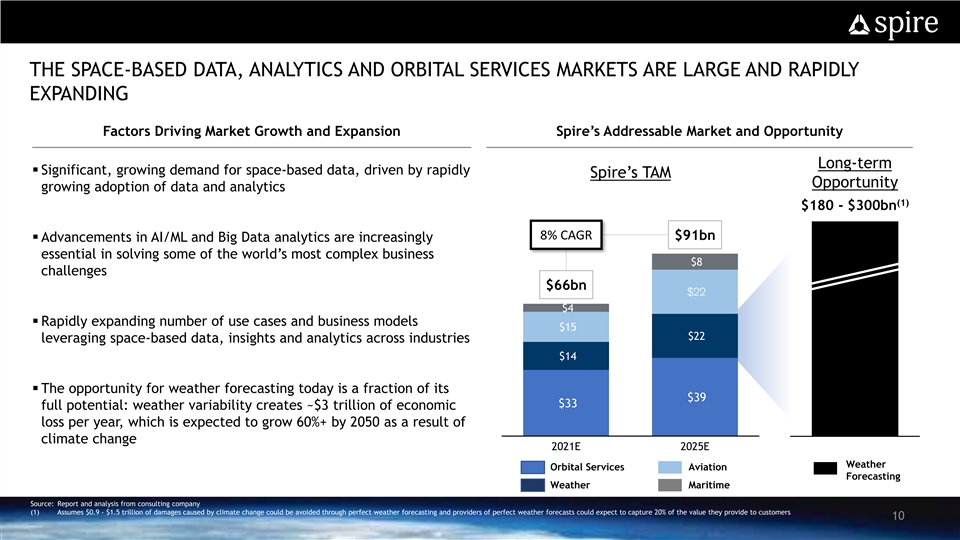
THE SPACE-BASED DATA, ANALYTICS AND ORBITAL SERVICES MARKETS ARE LARGE AND RAPIDLY EXPANDING Factors Driving Market Growth and Expansion Spire’s Addressable Market and Opportunity Long-term § Significant, growing demand for space-based data, driven by rapidly Spire’s TAM Opportunity growing adoption of data and analytics (1) $180 - $300bn 8% CAGR $91bn § Advancements in AI/ML and Big Data analytics are increasingly essential in solving some of the world’s most complex business $8 challenges $66bn $22 $4 § Rapidly expanding number of use cases and business models $15 $22 leveraging space-based data, insights and analytics across industries $14 § The opportunity for weather forecasting today is a fraction of its $39 $33 full potential: weather variability creates ~$3 trillion of economic loss per year, which is expected to grow 60%+ by 2050 as a result of climate change 2021E 2025E 2021E Weather Orbital Services Aviation Forecasting Weather Maritime Source: Report and analysis from consulting company (1) Assumes $0.9 - $1.5 trillion of damages caused by climate change could be avoided through perfect weather forecasting and providers of perfect weather forecasts could expect to capture 20% of the value they provide to customers 10THE SPACE-BASED DATA, ANALYTICS AND ORBITAL SERVICES MARKETS ARE LARGE AND RAPIDLY EXPANDING Factors Driving Market Growth and Expansion Spire’s Addressable Market and Opportunity Long-term § Significant, growing demand for space-based data, driven by rapidly Spire’s TAM Opportunity growing adoption of data and analytics (1) $180 - $300bn 8% CAGR $91bn § Advancements in AI/ML and Big Data analytics are increasingly essential in solving some of the world’s most complex business $8 challenges $66bn $22 $4 § Rapidly expanding number of use cases and business models $15 $22 leveraging space-based data, insights and analytics across industries $14 § The opportunity for weather forecasting today is a fraction of its $39 $33 full potential: weather variability creates ~$3 trillion of economic loss per year, which is expected to grow 60%+ by 2050 as a result of climate change 2021E 2025E 2021E Weather Orbital Services Aviation Forecasting Weather Maritime Source: Report and analysis from consulting company (1) Assumes $0.9 - $1.5 trillion of damages caused by climate change could be avoided through perfect weather forecasting and providers of perfect weather forecasts could expect to capture 20% of the value they provide to customers 10
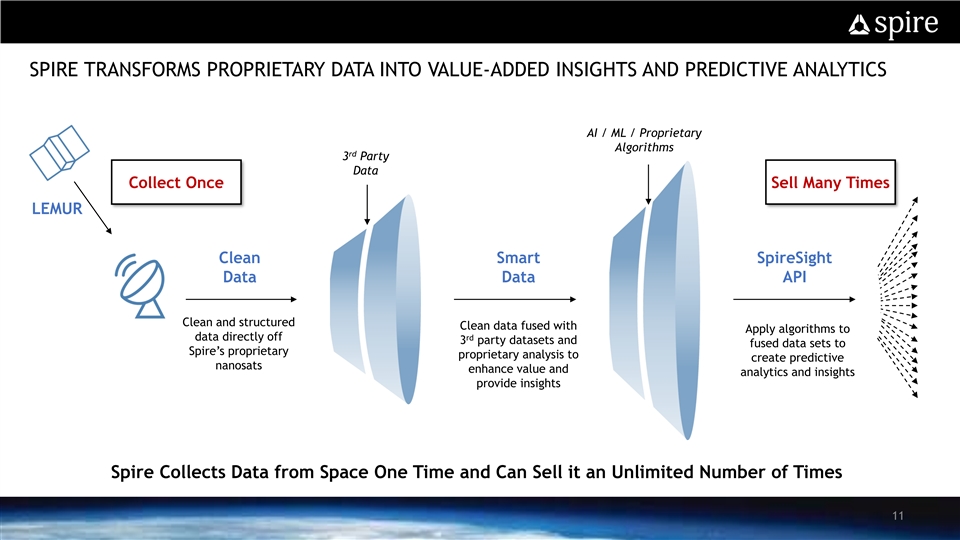
SPIRE TRANSFORMS PROPRIETARY DATA INTO VALUE-ADDED INSIGHTS AND PREDICTIVE ANALYTICS AI / ML / Proprietary Algorithms rd 3 Party Data Collect Once Sell Many Times LEMUR Clean Smart SpireSight Data Data API Clean and structured Clean data fused with Apply algorithms to data directly off rd 3 party datasets and fused data sets to Spire’s proprietary proprietary analysis to create predictive nanosats enhance value and analytics and insights provide insights Spire Collects Data from Space One Time and Can Sell it an Unlimited Number of Times 11SPIRE TRANSFORMS PROPRIETARY DATA INTO VALUE-ADDED INSIGHTS AND PREDICTIVE ANALYTICS AI / ML / Proprietary Algorithms rd 3 Party Data Collect Once Sell Many Times LEMUR Clean Smart SpireSight Data Data API Clean and structured Clean data fused with Apply algorithms to data directly off rd 3 party datasets and fused data sets to Spire’s proprietary proprietary analysis to create predictive nanosats enhance value and analytics and insights provide insights Spire Collects Data from Space One Time and Can Sell it an Unlimited Number of Times 11
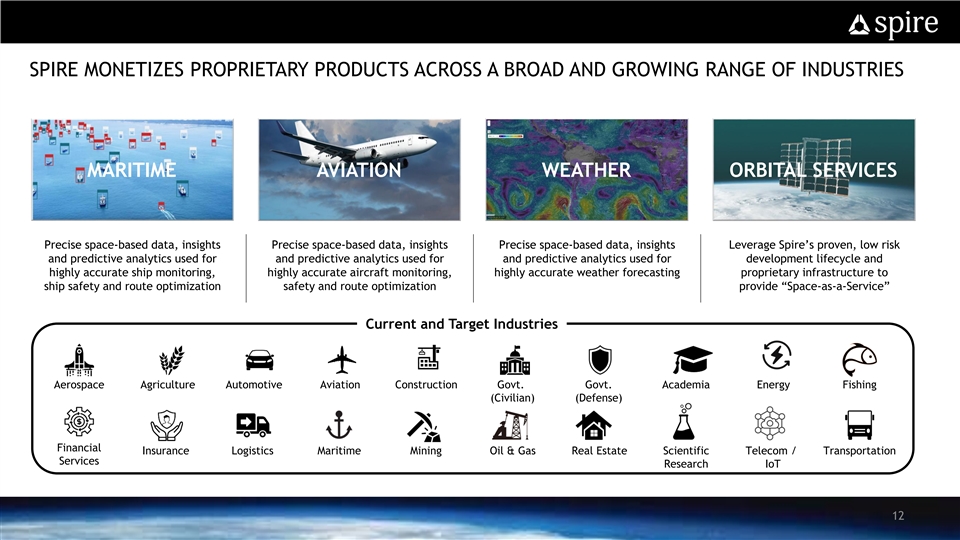
SPIRE MONETIZES PROPRIETARY PRODUCTS ACROSS A BROAD AND GROWING RANGE OF INDUSTRIES MARITIME AVIATION WEATHER ORBITAL SERVICES Precise space-based data, insights Precise space-based data, insights Precise space-based data, insights Leverage Spire’s proven, low risk and predictive analytics used for and predictive analytics used for and predictive analytics used for development lifecycle and highly accurate ship monitoring, highly accurate aircraft monitoring, highly accurate weather forecasting proprietary infrastructure to ship safety and route optimization safety and route optimization provide “Space-as-a-Service” Current and Target Industries Aerospace Agriculture Automotive Aviation Construction Govt. Govt. Academia Energy Fishing (Civilian) (Defense) Financial Insurance Logistics Maritime Mining Oil & Gas Real Estate Scientific Telecom / Transportation Services Research IoT 12SPIRE MONETIZES PROPRIETARY PRODUCTS ACROSS A BROAD AND GROWING RANGE OF INDUSTRIES MARITIME AVIATION WEATHER ORBITAL SERVICES Precise space-based data, insights Precise space-based data, insights Precise space-based data, insights Leverage Spire’s proven, low risk and predictive analytics used for and predictive analytics used for and predictive analytics used for development lifecycle and highly accurate ship monitoring, highly accurate aircraft monitoring, highly accurate weather forecasting proprietary infrastructure to ship safety and route optimization safety and route optimization provide “Space-as-a-Service” Current and Target Industries Aerospace Agriculture Automotive Aviation Construction Govt. Govt. Academia Energy Fishing (Civilian) (Defense) Financial Insurance Logistics Maritime Mining Oil & Gas Real Estate Scientific Telecom / Transportation Services Research IoT 12
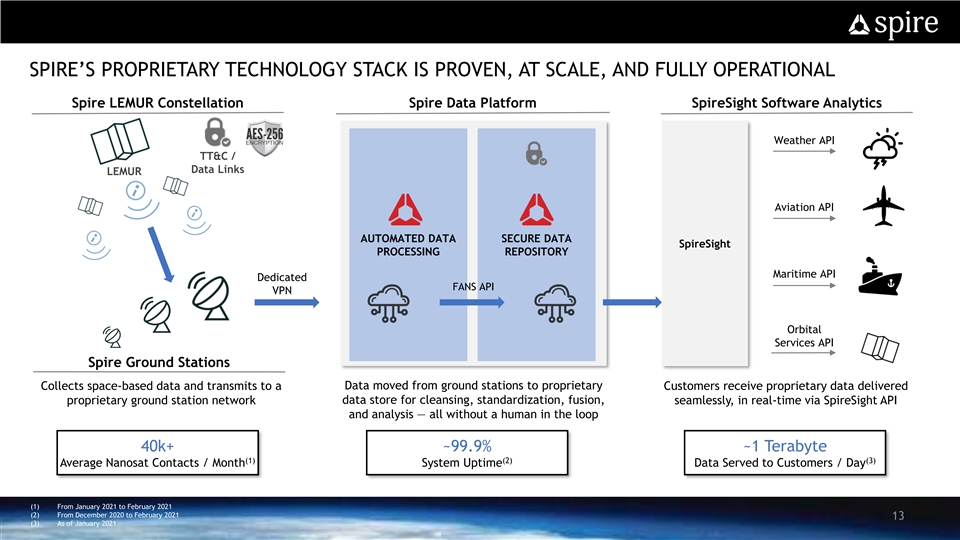
SPIRE’S PROPRIETARY TECHNOLOGY STACK IS PROVEN, AT SCALE, AND FULLY OPERATIONAL Spire LEMUR Constellation Spire Data Platform SpireSight Software Analytics Weather API TT&C / Data Links LEMUR Aviation API AUTOMATED DATA SECURE DATA SpireSight PROCESSING REPOSITORY Maritime API Dedicated FANS API VPN Orbital Services API Spire Ground Stations Collects space-based data and transmits to a Data moved from ground stations to proprietary Customers receive proprietary data delivered proprietary ground station network data store for cleansing, standardization, fusion, seamlessly, in real-time via SpireSight API and analysis — all without a human in the loop 40k+ ~99.9% ~1 Terabyte (1) (2) (3) Average Nanosat Contacts / Month System Uptime Data Served to Customers / Day (1) From January 2021 to February 2021 (2) From December 2020 to February 2021 13 (3) As of January 2021SPIRE’S PROPRIETARY TECHNOLOGY STACK IS PROVEN, AT SCALE, AND FULLY OPERATIONAL Spire LEMUR Constellation Spire Data Platform SpireSight Software Analytics Weather API TT&C / Data Links LEMUR Aviation API AUTOMATED DATA SECURE DATA SpireSight PROCESSING REPOSITORY Maritime API Dedicated FANS API VPN Orbital Services API Spire Ground Stations Collects space-based data and transmits to a Data moved from ground stations to proprietary Customers receive proprietary data delivered proprietary ground station network data store for cleansing, standardization, fusion, seamlessly, in real-time via SpireSight API and analysis — all without a human in the loop 40k+ ~99.9% ~1 Terabyte (1) (2) (3) Average Nanosat Contacts / Month System Uptime Data Served to Customers / Day (1) From January 2021 to February 2021 (2) From December 2020 to February 2021 13 (3) As of January 2021
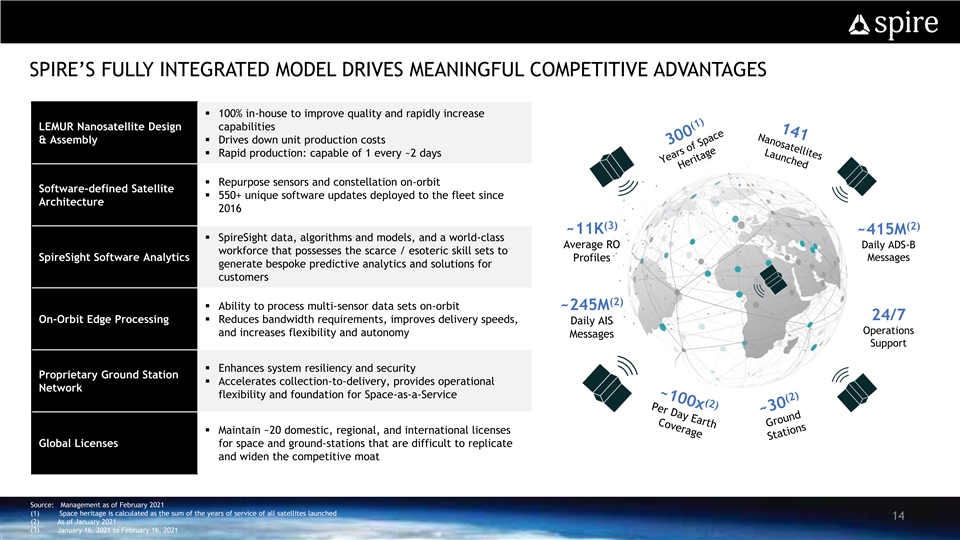
SPIRE’S FULLY INTEGRATED MODEL DRIVES MEANINGFUL COMPETITIVE ADVANTAGES § 100% in-house to improve quality and rapidly increase LEMUR Nanosatellite Design capabilities & Assembly§ Drives down unit production costs § Rapid production: capable of 1 every ~2 days § Repurpose sensors and constellation on-orbit Software-defined Satellite § 550+ unique software updates deployed to the fleet since Architecture 2016 (3) (2) ~11K ~415M § SpireSight data, algorithms and models, and a world-class Average RO Daily ADS-B workforce that possesses the scarce / esoteric skill sets to SpireSight Software Analytics Profiles Messages generate bespoke predictive analytics and solutions for customers (2) § Ability to process multi-sensor data sets on-orbit ~245M 24/7 On-Orbit Edge Processing§ Reduces bandwidth requirements, improves delivery speeds, Daily AIS Operations and increases flexibility and autonomy Messages Support § Enhances system resiliency and security Proprietary Ground Station § Accelerates collection-to-delivery, provides operational Network flexibility and foundation for Space-as-a-Service § Maintain ~20 domestic, regional, and international licenses Global Licenses for space and ground-stations that are difficult to replicate and widen the competitive moat Source: Management as of February 2021 (1) Space heritage is calculated as the sum of the years of service of all satellites launched 14 (2) As of January 2021 (3) January 16. 2021 to February 16, 2021SPIRE’S FULLY INTEGRATED MODEL DRIVES MEANINGFUL COMPETITIVE ADVANTAGES § 100% in-house to improve quality and rapidly increase LEMUR Nanosatellite Design capabilities & Assembly§ Drives down unit production costs § Rapid production: capable of 1 every ~2 days § Repurpose sensors and constellation on-orbit Software-defined Satellite § 550+ unique software updates deployed to the fleet since Architecture 2016 (3) (2) ~11K ~415M § SpireSight data, algorithms and models, and a world-class Average RO Daily ADS-B workforce that possesses the scarce / esoteric skill sets to SpireSight Software Analytics Profiles Messages generate bespoke predictive analytics and solutions for customers (2) § Ability to process multi-sensor data sets on-orbit ~245M 24/7 On-Orbit Edge Processing§ Reduces bandwidth requirements, improves delivery speeds, Daily AIS Operations and increases flexibility and autonomy Messages Support § Enhances system resiliency and security Proprietary Ground Station § Accelerates collection-to-delivery, provides operational Network flexibility and foundation for Space-as-a-Service § Maintain ~20 domestic, regional, and international licenses Global Licenses for space and ground-stations that are difficult to replicate and widen the competitive moat Source: Management as of February 2021 (1) Space heritage is calculated as the sum of the years of service of all satellites launched 14 (2) As of January 2021 (3) January 16. 2021 to February 16, 2021
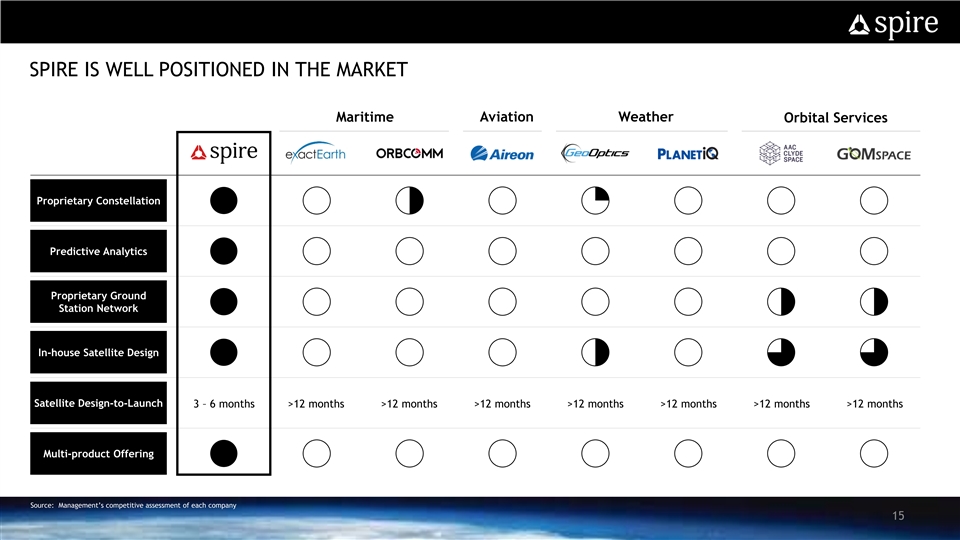
SPIRE IS WELL POSITIONED IN THE MARKET Maritime Aviation Weather Orbital Services Proprietary Constellation Predictive Analytics Proprietary Ground Station Network In-house Satellite Design Satellite Design-to-Launch 3 – 6 months >12 months >12 months >12 months >12 months >12 months >12 months >12 months Multi-product Offering Source: Management’s competitive assessment of each company 15SPIRE IS WELL POSITIONED IN THE MARKET Maritime Aviation Weather Orbital Services Proprietary Constellation Predictive Analytics Proprietary Ground Station Network In-house Satellite Design Satellite Design-to-Launch 3 – 6 months >12 months >12 months >12 months >12 months >12 months >12 months >12 months Multi-product Offering Source: Management’s competitive assessment of each company 15
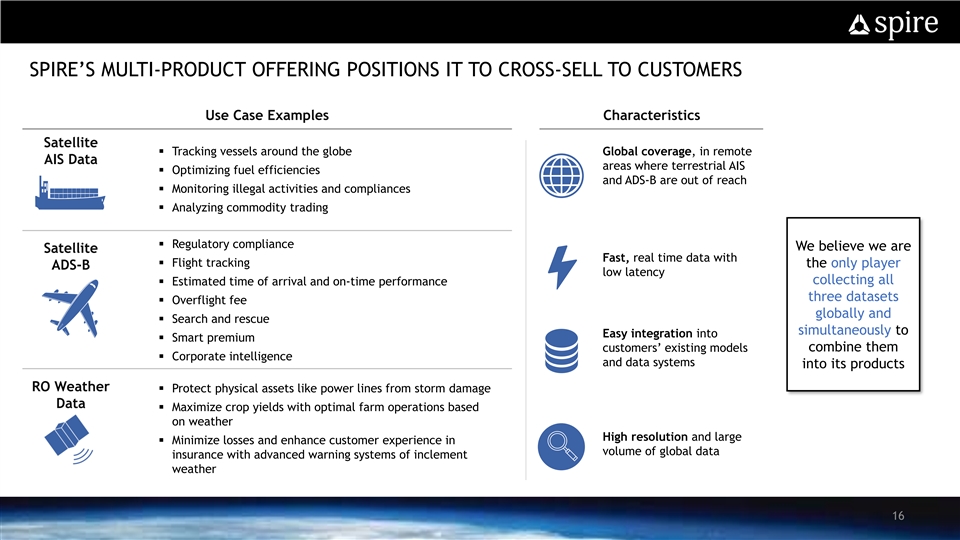
SPIRE’S MULTI-PRODUCT OFFERING POSITIONS IT TO CROSS-SELL TO CUSTOMERS Use Case Examples Characteristics Satellite § Tracking vessels around the globe Global coverage, in remote AIS Data areas where terrestrial AIS § Optimizing fuel efficiencies and ADS-B are out of reach § Monitoring illegal activities and compliances § Analyzing commodity trading § Regulatory compliance We believe we are Satellite Fast, real time data with § Flight tracking the only player ADS-B low latency collecting all § Estimated time of arrival and on-time performance three datasets § Overflight fee globally and § Search and rescue simultaneously to Easy integration into § Smart premium customers’ existing models combine them § Corporate intelligence and data systems into its products RO Weather § Protect physical assets like power lines from storm damage Data § Maximize crop yields with optimal farm operations based on weather High resolution and large § Minimize losses and enhance customer experience in volume of global data insurance with advanced warning systems of inclement weather 16SPIRE’S MULTI-PRODUCT OFFERING POSITIONS IT TO CROSS-SELL TO CUSTOMERS Use Case Examples Characteristics Satellite § Tracking vessels around the globe Global coverage, in remote AIS Data areas where terrestrial AIS § Optimizing fuel efficiencies and ADS-B are out of reach § Monitoring illegal activities and compliances § Analyzing commodity trading § Regulatory compliance We believe we are Satellite Fast, real time data with § Flight tracking the only player ADS-B low latency collecting all § Estimated time of arrival and on-time performance three datasets § Overflight fee globally and § Search and rescue simultaneously to Easy integration into § Smart premium customers’ existing models combine them § Corporate intelligence and data systems into its products RO Weather § Protect physical assets like power lines from storm damage Data § Maximize crop yields with optimal farm operations based on weather High resolution and large § Minimize losses and enhance customer experience in volume of global data insurance with advanced warning systems of inclement weather 16
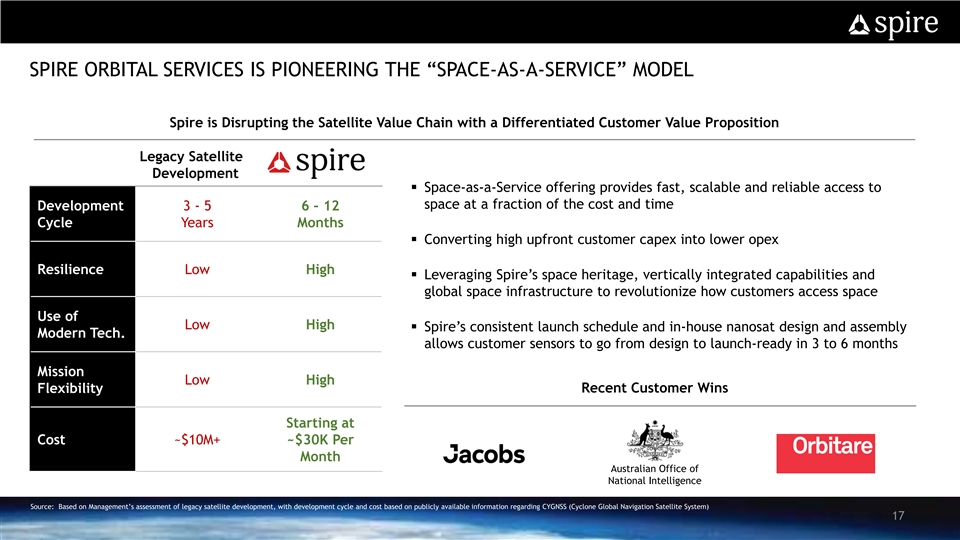
SPIRE ORBITAL SERVICES IS PIONEERING THE “SPACE-AS-A-SERVICE” MODEL Spire is Disrupting the Satellite Value Chain with a Differentiated Customer Value Proposition Legacy Satellite Development § Space-as-a-Service offering provides fast, scalable and reliable access to space at a fraction of the cost and time Development 3 - 5 6 – 12 Cycle Years Months § Converting high upfront customer capex into lower opex Resilience Low High § Leveraging Spire’s space heritage, vertically integrated capabilities and global space infrastructure to revolutionize how customers access space Use of Low High § Spire’s consistent launch schedule and in-house nanosat design and assembly Modern Tech. allows customer sensors to go from design to launch-ready in 3 to 6 months Mission Low High Flexibility Recent Customer Wins Starting at Cost ~$10M+ ~$30K Per Month Australian Office of National Intelligence Source: Based on Management’s assessment of legacy satellite development, with development cycle and cost based on publicly available information regarding CYGNSS (Cyclone Global Navigation Satellite System) 17SPIRE ORBITAL SERVICES IS PIONEERING THE “SPACE-AS-A-SERVICE” MODEL Spire is Disrupting the Satellite Value Chain with a Differentiated Customer Value Proposition Legacy Satellite Development § Space-as-a-Service offering provides fast, scalable and reliable access to space at a fraction of the cost and time Development 3 - 5 6 – 12 Cycle Years Months § Converting high upfront customer capex into lower opex Resilience Low High § Leveraging Spire’s space heritage, vertically integrated capabilities and global space infrastructure to revolutionize how customers access space Use of Low High § Spire’s consistent launch schedule and in-house nanosat design and assembly Modern Tech. allows customer sensors to go from design to launch-ready in 3 to 6 months Mission Low High Flexibility Recent Customer Wins Starting at Cost ~$10M+ ~$30K Per Month Australian Office of National Intelligence Source: Based on Management’s assessment of legacy satellite development, with development cycle and cost based on publicly available information regarding CYGNSS (Cyclone Global Navigation Satellite System) 17
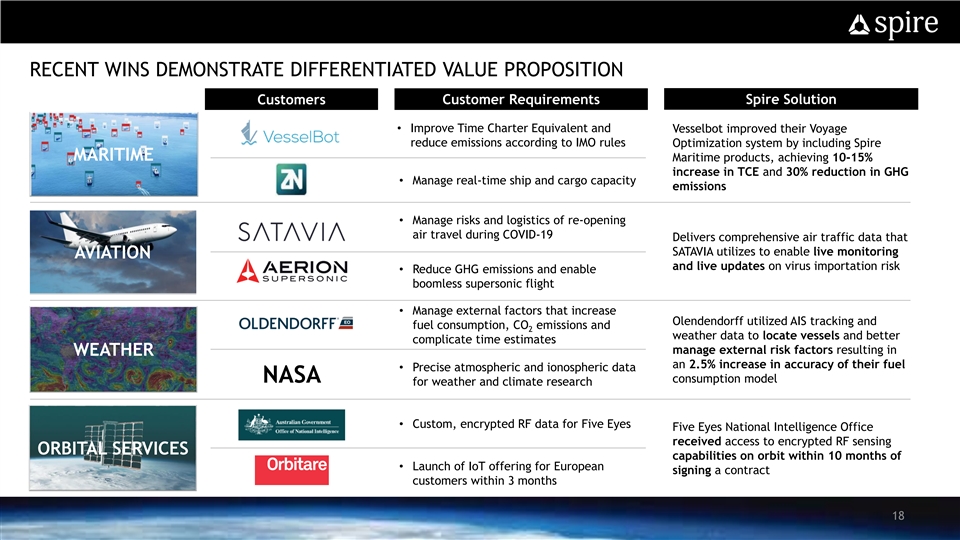
RECENT WINS DEMONSTRATE DIFFERENTIATED VALUE PROPOSITION Customers Customer Requirements Spire Solution • Improve Time Charter Equivalent and Vesselbot improved their Voyage reduce emissions according to IMO rules Optimization system by including Spire MARITIME Maritime products, achieving 10-15% increase in TCE and 30% reduction in GHG • Manage real-time ship and cargo capacity emissions • Manage risks and logistics of re-opening air travel during COVID-19 Delivers comprehensive air traffic data that SATAVIA utilizes to enable live monitoring AVIATION and live updates on virus importation risk • Reduce GHG emissions and enable boomless supersonic flight • Manage external factors that increase Olendendorff utilized AIS tracking and fuel consumption, CO emissions and 2 weather data to locate vessels and better complicate time estimates manage external risk factors resulting in WEATHER an 2.5% increase in accuracy of their fuel • Precise atmospheric and ionospheric data NASA consumption model for weather and climate research • Custom, encrypted RF data for Five Eyes Five Eyes National Intelligence Office received access to encrypted RF sensing ORBITAL SERVICES capabilities on orbit within 10 months of • Launch of IoT offering for European signing a contract customers within 3 months 18RECENT WINS DEMONSTRATE DIFFERENTIATED VALUE PROPOSITION Customers Customer Requirements Spire Solution • Improve Time Charter Equivalent and Vesselbot improved their Voyage reduce emissions according to IMO rules Optimization system by including Spire MARITIME Maritime products, achieving 10-15% increase in TCE and 30% reduction in GHG • Manage real-time ship and cargo capacity emissions • Manage risks and logistics of re-opening air travel during COVID-19 Delivers comprehensive air traffic data that SATAVIA utilizes to enable live monitoring AVIATION and live updates on virus importation risk • Reduce GHG emissions and enable boomless supersonic flight • Manage external factors that increase Olendendorff utilized AIS tracking and fuel consumption, CO emissions and 2 weather data to locate vessels and better complicate time estimates manage external risk factors resulting in WEATHER an 2.5% increase in accuracy of their fuel • Precise atmospheric and ionospheric data NASA consumption model for weather and climate research • Custom, encrypted RF data for Five Eyes Five Eyes National Intelligence Office received access to encrypted RF sensing ORBITAL SERVICES capabilities on orbit within 10 months of • Launch of IoT offering for European signing a contract customers within 3 months 18
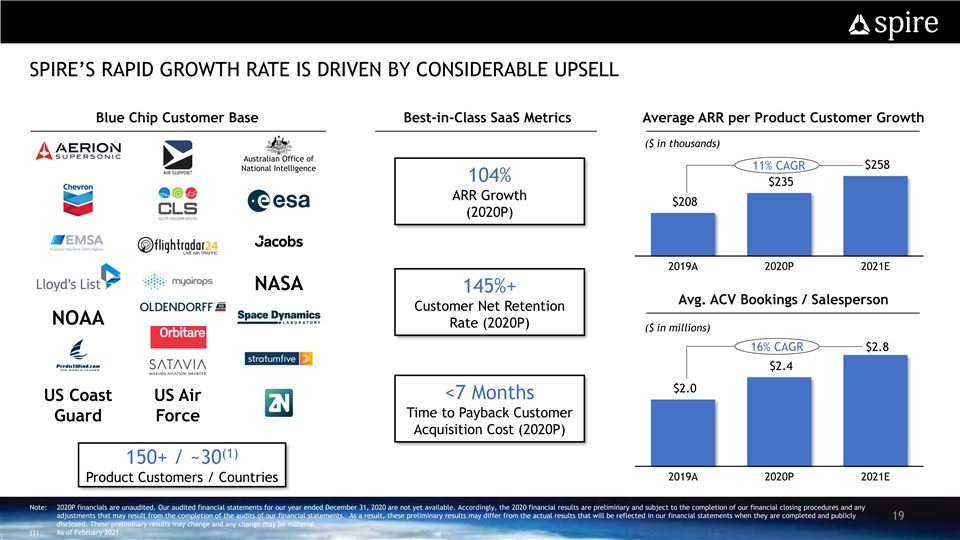
SPIRE’S RAPID GROWTH RATE IS DRIVEN BY CONSIDERABLE UPSELL Blue Chip Customer Base Best-in-Class SaaS Metrics Average ARR per Product Customer Growth ($ in thousands) Australian Office of $258 11% CAGR National Intelligence 104% $235 ARR Growth $208 (2020P) 2019A 2020P 2021E NASA 145%+ Avg. ACV Bookings / Salesperson Customer Net Retention NOAA Rate (2020P) ($ in millions) 16% CAGR $2.8 $2.4 $2.0 <7 Months US Coast US Air Time to Payback Customer Guard Force Acquisition Cost (2020P) (1) 150+ / ~30 2019A 2020P 2021E Product Customers / Countries Note: 2020P financials are unaudited. Our audited financial statements for our year ended December 31, 2020 are not yet available. Accordingly, the 2020 financial results are preliminary and subject to the completion of our financial closing procedures and any adjustments that may result from the completion of the audits of our financial statements. As a result, these preliminary results may differ from the actual results that will be reflected in our financial statements when they are completed and publicly 19 disclosed. These preliminary results may change and any change may be material (1) As of February 2021SPIRE’S RAPID GROWTH RATE IS DRIVEN BY CONSIDERABLE UPSELL Blue Chip Customer Base Best-in-Class SaaS Metrics Average ARR per Product Customer Growth ($ in thousands) Australian Office of $258 11% CAGR National Intelligence 104% $235 ARR Growth $208 (2020P) 2019A 2020P 2021E NASA 145%+ Avg. ACV Bookings / Salesperson Customer Net Retention NOAA Rate (2020P) ($ in millions) 16% CAGR $2.8 $2.4 $2.0 <7 Months US Coast US Air Time to Payback Customer Guard Force Acquisition Cost (2020P) (1) 150+ / ~30 2019A 2020P 2021E Product Customers / Countries Note: 2020P financials are unaudited. Our audited financial statements for our year ended December 31, 2020 are not yet available. Accordingly, the 2020 financial results are preliminary and subject to the completion of our financial closing procedures and any adjustments that may result from the completion of the audits of our financial statements. As a result, these preliminary results may differ from the actual results that will be reflected in our financial statements when they are completed and publicly 19 disclosed. These preliminary results may change and any change may be material (1) As of February 2021
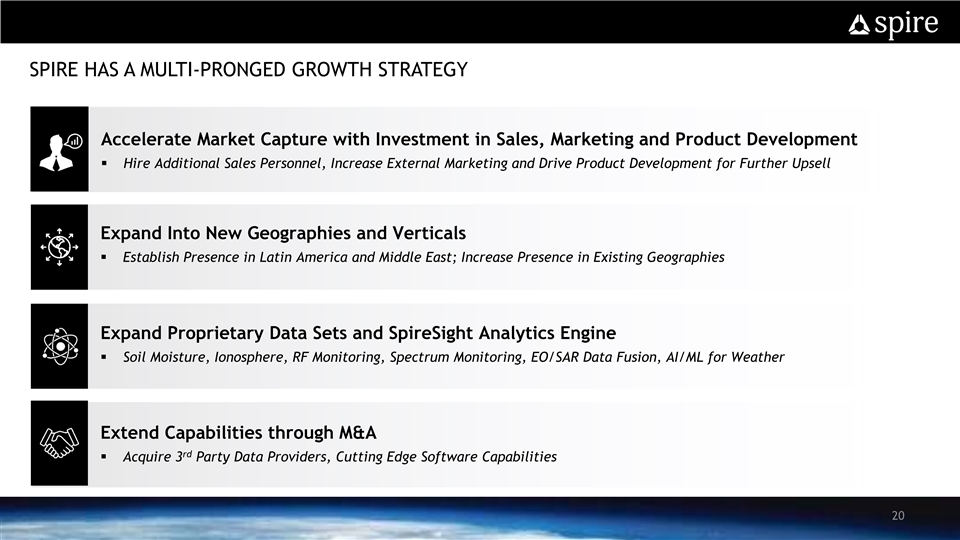
SPIRE HAS A MULTI-PRONGED GROWTH STRATEGY Accelerate Market Capture with Investment in Sales, Marketing and Product Development § Hire Additional Sales Personnel, Increase External Marketing and Drive Product Development for Further Upsell Expand Into New Geographies and Verticals § Establish Presence in Latin America and Middle East; Increase Presence in Existing Geographies Expand Proprietary Data Sets and SpireSight Analytics Engine § Soil Moisture, Ionosphere, RF Monitoring, Spectrum Monitoring, EO/SAR Data Fusion, AI/ML for Weather Extend Capabilities through M&A rd § Acquire 3 Party Data Providers, Cutting Edge Software Capabilities 20SPIRE HAS A MULTI-PRONGED GROWTH STRATEGY Accelerate Market Capture with Investment in Sales, Marketing and Product Development § Hire Additional Sales Personnel, Increase External Marketing and Drive Product Development for Further Upsell Expand Into New Geographies and Verticals § Establish Presence in Latin America and Middle East; Increase Presence in Existing Geographies Expand Proprietary Data Sets and SpireSight Analytics Engine § Soil Moisture, Ionosphere, RF Monitoring, Spectrum Monitoring, EO/SAR Data Fusion, AI/ML for Weather Extend Capabilities through M&A rd § Acquire 3 Party Data Providers, Cutting Edge Software Capabilities 20
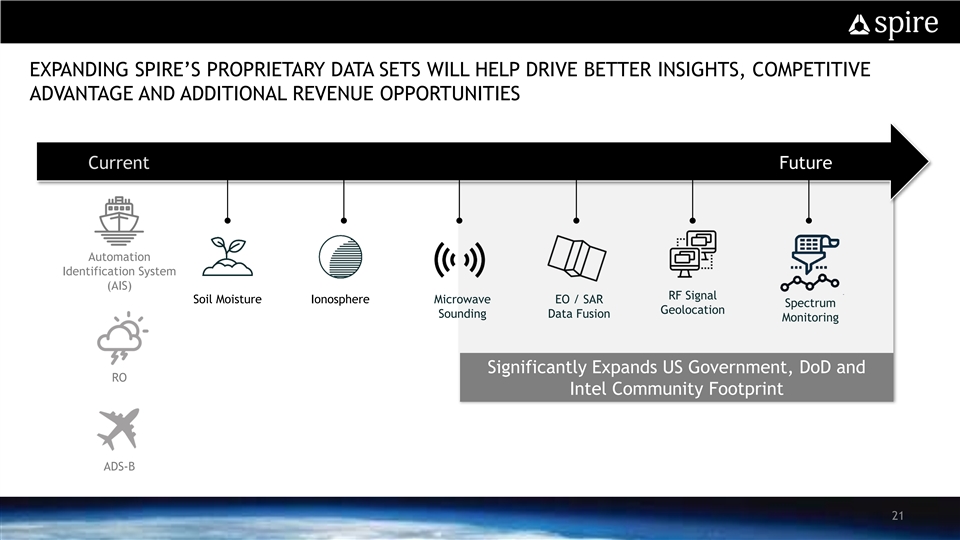
EXPANDING SPIRE’S PROPRIETARY DATA SETS WILL HELP DRIVE BETTER INSIGHTS, COMPETITIVE ADVANTAGE AND ADDITIONAL REVENUE OPPORTUNITIES Current Future Automation Identification System (AIS) RF Signal Soil Moisture Ionosphere Microwave EO / SAR Spectrum Geolocation Sounding Data Fusion Monitoring Significantly Expands US Government, DoD and RO Intel Community Footprint ADS-B 21EXPANDING SPIRE’S PROPRIETARY DATA SETS WILL HELP DRIVE BETTER INSIGHTS, COMPETITIVE ADVANTAGE AND ADDITIONAL REVENUE OPPORTUNITIES Current Future Automation Identification System (AIS) RF Signal Soil Moisture Ionosphere Microwave EO / SAR Spectrum Geolocation Sounding Data Fusion Monitoring Significantly Expands US Government, DoD and RO Intel Community Footprint ADS-B 21
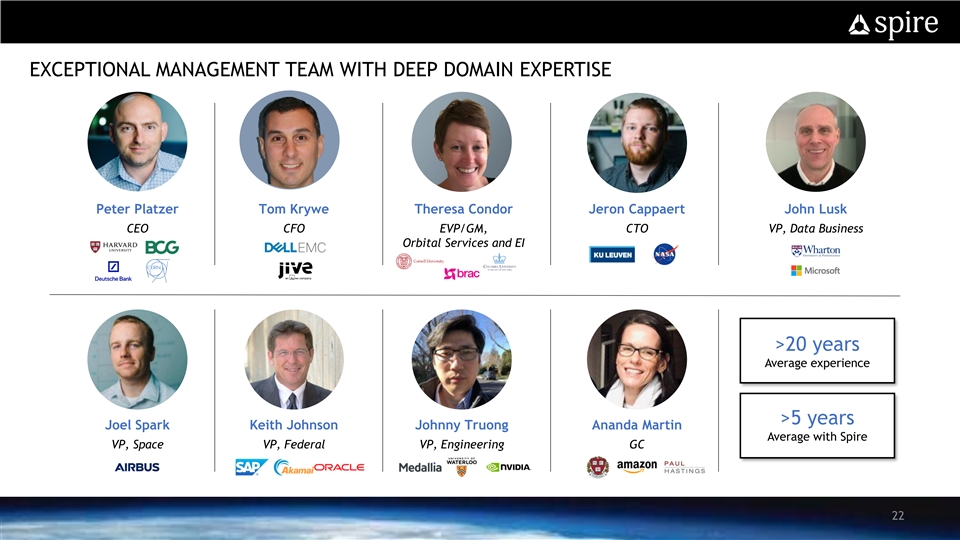
EXCEPTIONAL MANAGEMENT TEAM WITH DEEP DOMAIN EXPERTISE Peter Platzer Tom Krywe Theresa Condor Jeron Cappaert John Lusk CEO CFO EVP/GM, CTO VP, Data Business Orbital Services and EI >20 years Average experience >5 years Joel Spark Keith Johnson Johnny Truong Ananda Martin Average with Spire VP, Space VP, Federal VP, Engineering GC 22EXCEPTIONAL MANAGEMENT TEAM WITH DEEP DOMAIN EXPERTISE Peter Platzer Tom Krywe Theresa Condor Jeron Cappaert John Lusk CEO CFO EVP/GM, CTO VP, Data Business Orbital Services and EI >20 years Average experience >5 years Joel Spark Keith Johnson Johnny Truong Ananda Martin Average with Spire VP, Space VP, Federal VP, Engineering GC 22

FINANCIAL OVERVIEWFINANCIAL OVERVIEW
SPIRE KEY FINANCIAL HIGHLIGHTS Recurring Revenue Model with Exceptional SaaS KPIs Land and Expand Strategy Drives Revenue Visibility and NRR (~145% in 2020P) Strong Growth in ARR Drives Top Line Momentum (1) Highly Scalable Model with 90%+ Gross Margins and 80%+ FCF Conversion by 2025E Clear Path to Profitability; Transaction Expected to Fully Fund the Growth Plan Note: This slide contains non-GAAP financial measures and key metrics relating to Spire’s past and expected future performance. You can find the reconciliation of these measures to the most directly comparable GAAP financial measure in the Appendix at the end of this presentation. The non-GAAP financial measures disclosed in this presentation should not be considered a substitute for, or superior to, the financial measures prepared in accordance with GAAP 24 2020P financials are unaudited. Our audited financial statements for our year ended December 31, 2020 are not yet available. Accordingly, the 2020 financial results are preliminary and subject to the completion of our financial closing procedures and any adjustments that may result from the completion of the audits of our financial statements. As a result, these preliminary results may differ from the actual results that will be reflected in our financial statements when they are completed and publicly disclosed. These preliminary results may change and any change may be material (1) FCF is a non-GAAP measure defined as Adj. EBITDA - Capex. FCF conversion defined as (Adj. EBITDA – Capex) / Adj. EBITDASPIRE KEY FINANCIAL HIGHLIGHTS Recurring Revenue Model with Exceptional SaaS KPIs Land and Expand Strategy Drives Revenue Visibility and NRR (~145% in 2020P) Strong Growth in ARR Drives Top Line Momentum (1) Highly Scalable Model with 90%+ Gross Margins and 80%+ FCF Conversion by 2025E Clear Path to Profitability; Transaction Expected to Fully Fund the Growth Plan Note: This slide contains non-GAAP financial measures and key metrics relating to Spire’s past and expected future performance. You can find the reconciliation of these measures to the most directly comparable GAAP financial measure in the Appendix at the end of this presentation. The non-GAAP financial measures disclosed in this presentation should not be considered a substitute for, or superior to, the financial measures prepared in accordance with GAAP 24 2020P financials are unaudited. Our audited financial statements for our year ended December 31, 2020 are not yet available. Accordingly, the 2020 financial results are preliminary and subject to the completion of our financial closing procedures and any adjustments that may result from the completion of the audits of our financial statements. As a result, these preliminary results may differ from the actual results that will be reflected in our financial statements when they are completed and publicly disclosed. These preliminary results may change and any change may be material (1) FCF is a non-GAAP measure defined as Adj. EBITDA - Capex. FCF conversion defined as (Adj. EBITDA – Capex) / Adj. EBITDA
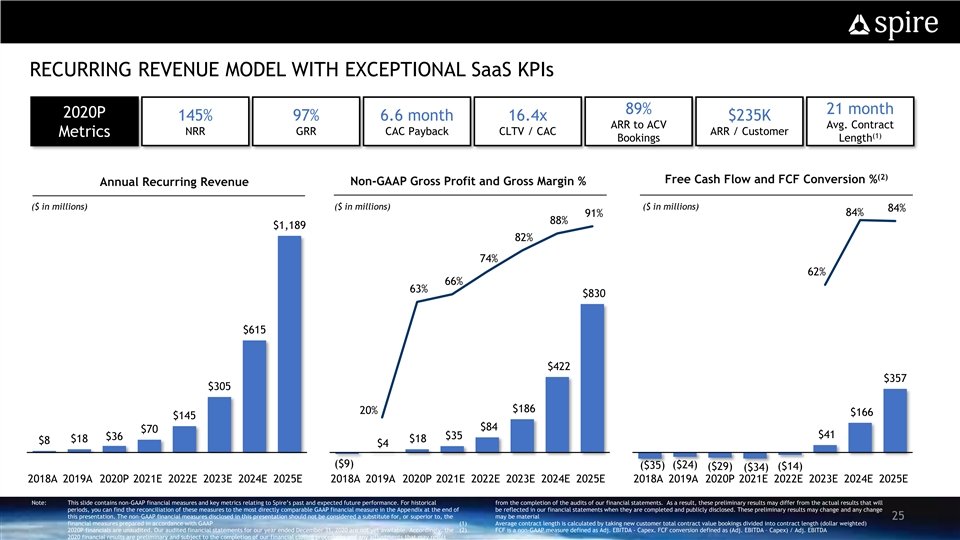
RECURRING REVENUE MODEL WITH EXCEPTIONAL SaaS KPIs 89% 21 month 2020P 145% 97% 6.6 month 16.4x $235K ARR to ACV Avg. Contract NRR GRR CAC Payback CLTV / CAC ARR / Customer Metrics (1) Bookings Length (2) Free Cash Flow and FCF Conversion % Non-GAAP Gross Profit and Gross Margin % Annual Recurring Revenue ($ in millions) ($ in millions) ($ in millions) 84% 84% 91% 88% $1,189 82% 74% 62% 66% 63% $830 $615 $422 $357 $305 $186 20% $166 $145 $84 $70 $41 $35 $36 $18 $18 $8 $4 ($9) ($24) ($35) ($29) ($14) ($34) 2018A 2019A 2020P 2021E 2022E 2023E 2024E 2025E 2018A 2019A 2020P 2021E 2022E 2023E 2024E 2025E 2018A 2019A 2020P 2021E 2022E 2023E 2024E 2025E Note: This slide contains non-GAAP financial measures and key metrics relating to Spire’s past and expected future performance. For historical from the completion of the audits of our financial statements. As a result, these preliminary results may differ from the actual results that will periods, you can find the reconciliation of these measures to the most directly comparable GAAP financial measure in the Appendix at the end of be reflected in our financial statements when they are completed and publicly disclosed. These preliminary results may change and any change this presentation. The non-GAAP financial measures disclosed in this presentation should not be considered a substitute for, or superior to, the may be material 25 financial measures prepared in accordance with GAAP (1) Average contract length is calculated by taking new customer total contract value bookings divided into contract length (dollar weighted) 2020P financials are unaudited. Our audited financial statements for our year ended December 31, 2020 are not yet available. Accordingly, the (2) FCF is a non-GAAP measure defined as Adj. EBITDA - Capex. FCF conversion defined as (Adj. EBITDA – Capex) / Adj. EBITDA 2020 financial results are preliminary and subject to the completion of our financial closing procedures and any adjustments that may result RECURRING REVENUE MODEL WITH EXCEPTIONAL SaaS KPIs 89% 21 month 2020P 145% 97% 6.6 month 16.4x $235K ARR to ACV Avg. Contract NRR GRR CAC Payback CLTV / CAC ARR / Customer Metrics (1) Bookings Length (2) Free Cash Flow and FCF Conversion % Non-GAAP Gross Profit and Gross Margin % Annual Recurring Revenue ($ in millions) ($ in millions) ($ in millions) 84% 84% 91% 88% $1,189 82% 74% 62% 66% 63% $830 $615 $422 $357 $305 $186 20% $166 $145 $84 $70 $41 $35 $36 $18 $18 $8 $4 ($9) ($24) ($35) ($29) ($14) ($34) 2018A 2019A 2020P 2021E 2022E 2023E 2024E 2025E 2018A 2019A 2020P 2021E 2022E 2023E 2024E 2025E 2018A 2019A 2020P 2021E 2022E 2023E 2024E 2025E Note: This slide contains non-GAAP financial measures and key metrics relating to Spire’s past and expected future performance. For historical from the completion of the audits of our financial statements. As a result, these preliminary results may differ from the actual results that will periods, you can find the reconciliation of these measures to the most directly comparable GAAP financial measure in the Appendix at the end of be reflected in our financial statements when they are completed and publicly disclosed. These preliminary results may change and any change this presentation. The non-GAAP financial measures disclosed in this presentation should not be considered a substitute for, or superior to, the may be material 25 financial measures prepared in accordance with GAAP (1) Average contract length is calculated by taking new customer total contract value bookings divided into contract length (dollar weighted) 2020P financials are unaudited. Our audited financial statements for our year ended December 31, 2020 are not yet available. Accordingly, the (2) FCF is a non-GAAP measure defined as Adj. EBITDA - Capex. FCF conversion defined as (Adj. EBITDA – Capex) / Adj. EBITDA 2020 financial results are preliminary and subject to the completion of our financial closing procedures and any adjustments that may result
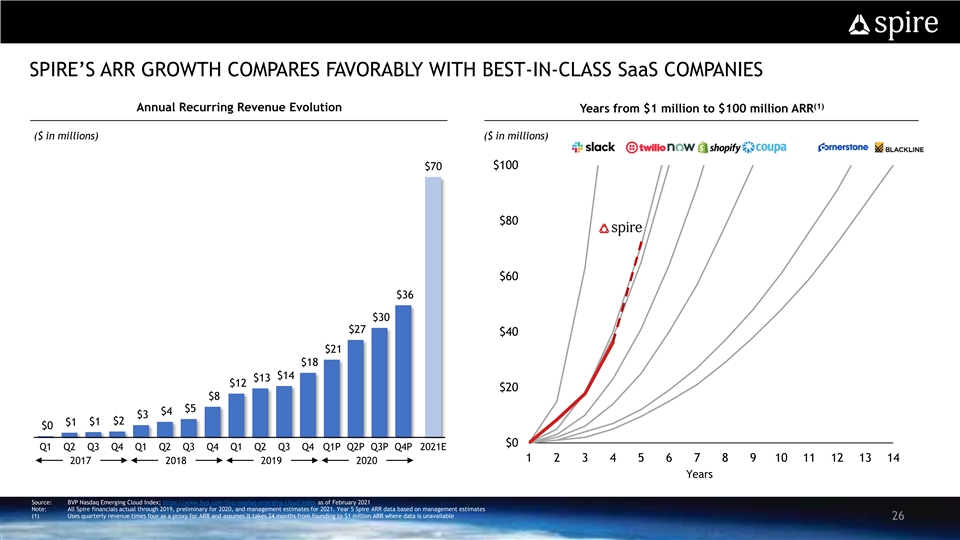
SPIRE’S ARR GROWTH COMPARES FAVORABLY WITH BEST-IN-CLASS SaaS COMPANIES (1) Annual Recurring Revenue Evolution Years from $1 million to $100 million ARR ($ in millions) ($ in millions) $100 $70 $80 $60 $36 $36 $30 $30 $27 $27 $40 $21 $21 $18 $18 $14 $14 $13 $13 $12 $12 $20 $8 $8 $5 $5 $4 $4 $3 $3 $1 $1 $2 $2 $1 $1 $0 $0 $0 Q1 Q1 Q2 Q3 Q3 Q4 Q1 Q1 Q2 Q3 Q3 Q4 Q1 Q1 Q2 Q3 Q3 Q4 Q1P Q1 Q2P Q3P Q3 Q4P 2021E 1 2 3 4 5 6 7 8 9 10 11 12 13 14 2017 2018 2019 2020 Years Source: BVP Nasdaq Emerging Cloud Index; https://www.bvp.com/bvp-nasdaq-emerging-cloud-index as of February 2021 Note: All Spire financials actual through 2019, preliminary for 2020, and management estimates for 2021. Year 5 Spire ARR data based on management estimates (1) Uses quarterly revenue times four as a proxy for ARR and assumes it takes 24 months from founding to $1 million ARR where data is unavailable 26SPIRE’S ARR GROWTH COMPARES FAVORABLY WITH BEST-IN-CLASS SaaS COMPANIES (1) Annual Recurring Revenue Evolution Years from $1 million to $100 million ARR ($ in millions) ($ in millions) $100 $70 $80 $60 $36 $36 $30 $30 $27 $27 $40 $21 $21 $18 $18 $14 $14 $13 $13 $12 $12 $20 $8 $8 $5 $5 $4 $4 $3 $3 $1 $1 $2 $2 $1 $1 $0 $0 $0 Q1 Q1 Q2 Q3 Q3 Q4 Q1 Q1 Q2 Q3 Q3 Q4 Q1 Q1 Q2 Q3 Q3 Q4 Q1P Q1 Q2P Q3P Q3 Q4P 2021E 1 2 3 4 5 6 7 8 9 10 11 12 13 14 2017 2018 2019 2020 Years Source: BVP Nasdaq Emerging Cloud Index; https://www.bvp.com/bvp-nasdaq-emerging-cloud-index as of February 2021 Note: All Spire financials actual through 2019, preliminary for 2020, and management estimates for 2021. Year 5 Spire ARR data based on management estimates (1) Uses quarterly revenue times four as a proxy for ARR and assumes it takes 24 months from founding to $1 million ARR where data is unavailable 26
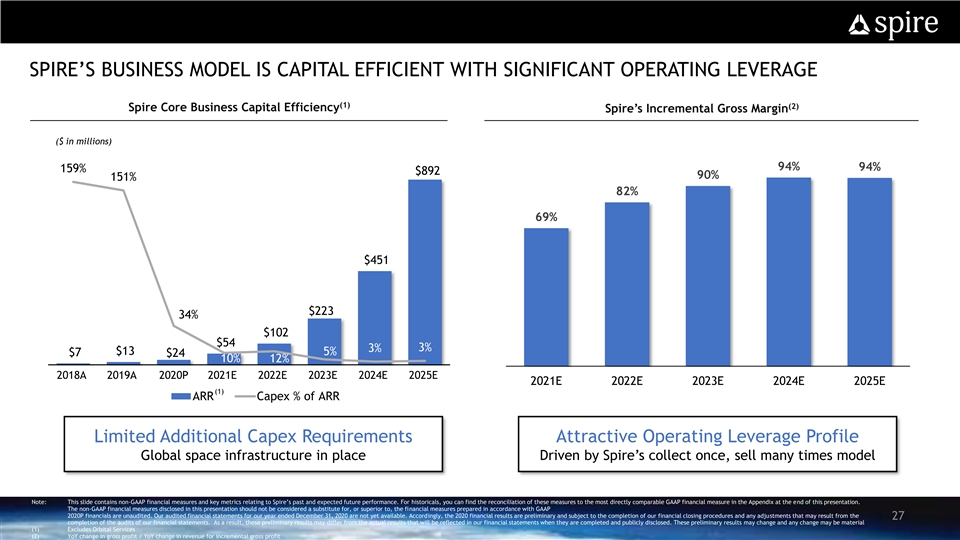
SPIRE’S BUSINESS MODEL IS CAPITAL EFFICIENT WITH SIGNIFICANT OPERATING LEVERAGE (1) (2) Spire Core Business Capital Efficiency Spire’s Incremental Gross Margin ($ in millions) 180% 94% 94% 159% $892 90% 151% 160% 82% 140% 69% 120% 100% $451 80% 60% $223 34% 40% $102 20% $54 3% 3% $13 5% $7 $24 10% 12% 0% 2018A 2019A 2020P 2021E 2022E 2023E 2024E 2025E 2021E 2022E 2023E 2024E 2025E (1) ARR Capex % of ARR Limited Additional Capex Requirements Attractive Operating Leverage Profile Global space infrastructure in place Driven by Spire’s collect once, sell many times model Note: This slide contains non-GAAP financial measures and key metrics relating to Spire’s past and expected future performance. For historicals, you can find the reconciliation of these measures to the most directly comparable GAAP financial measure in the Appendix at the end of this presentation. The non-GAAP financial measures disclosed in this presentation should not be considered a substitute for, or superior to, the financial measures prepared in accordance with GAAP 2020P financials are unaudited. Our audited financial statements for our year ended December 31, 2020 are not yet available. Accordingly, the 2020 financial results are preliminary and subject to the completion of our financial closing procedures and any adjustments that may result from the 27 completion of the audits of our financial statements. As a result, these preliminary results may differ from the actual results that will be reflected in our financial statements when they are completed and publicly disclosed. These preliminary results may change and any change may be material (1) Excludes Orbital Services (2) YoY change in gross profit / YoY change in revenue for incremental gross profitSPIRE’S BUSINESS MODEL IS CAPITAL EFFICIENT WITH SIGNIFICANT OPERATING LEVERAGE (1) (2) Spire Core Business Capital Efficiency Spire’s Incremental Gross Margin ($ in millions) 180% 94% 94% 159% $892 90% 151% 160% 82% 140% 69% 120% 100% $451 80% 60% $223 34% 40% $102 20% $54 3% 3% $13 5% $7 $24 10% 12% 0% 2018A 2019A 2020P 2021E 2022E 2023E 2024E 2025E 2021E 2022E 2023E 2024E 2025E (1) ARR Capex % of ARR Limited Additional Capex Requirements Attractive Operating Leverage Profile Global space infrastructure in place Driven by Spire’s collect once, sell many times model Note: This slide contains non-GAAP financial measures and key metrics relating to Spire’s past and expected future performance. For historicals, you can find the reconciliation of these measures to the most directly comparable GAAP financial measure in the Appendix at the end of this presentation. The non-GAAP financial measures disclosed in this presentation should not be considered a substitute for, or superior to, the financial measures prepared in accordance with GAAP 2020P financials are unaudited. Our audited financial statements for our year ended December 31, 2020 are not yet available. Accordingly, the 2020 financial results are preliminary and subject to the completion of our financial closing procedures and any adjustments that may result from the 27 completion of the audits of our financial statements. As a result, these preliminary results may differ from the actual results that will be reflected in our financial statements when they are completed and publicly disclosed. These preliminary results may change and any change may be material (1) Excludes Orbital Services (2) YoY change in gross profit / YoY change in revenue for incremental gross profit
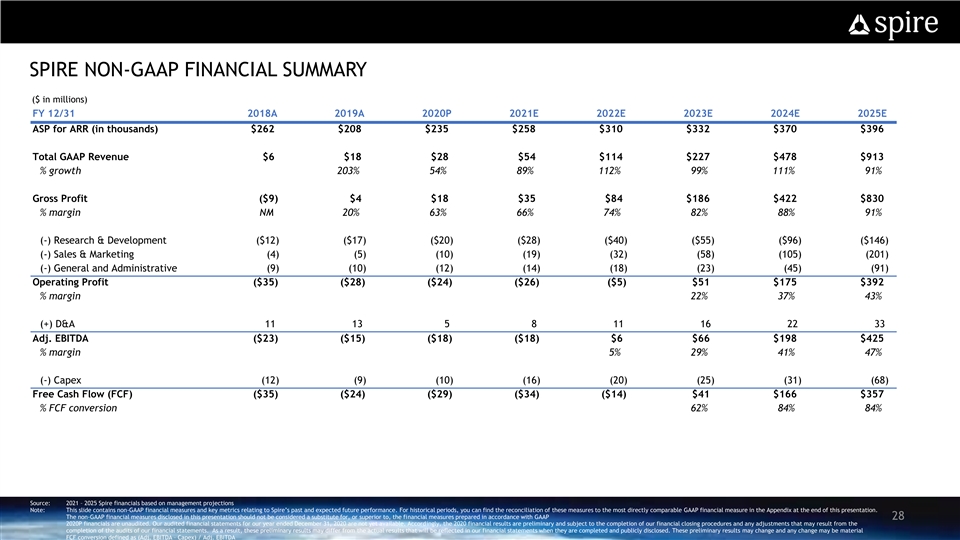
SPIRE NON-GAAP FINANCIAL SUMMARY ($ in millions) FY 12/31 2018A 2019A 2020P 2021E 2022E 2023E 2024E 2025E ASP for ARR (in thousands) $262 $208 $235 $258 $310 $332 $370 $396 Total GAAP Revenue $6 $18 $28 $54 $114 $227 $478 $913 % growth 203% 54% 89% 112% 99% 111% 91% Gross Profit ($9) $4 $18 $35 $84 $186 $422 $830 % margin NM 20% 63% 66% 74% 82% 88% 91% (-) Research & Development ($12) ($17) ($20) ($28) ($40) ($55) ($96) ($146) (-) Sales & Marketing (4) (5) (10) (19) (32) (58) (105) (201) (-) General and Administrative (9) (10) (12) (14) (18) (23) (45) (91) Operating Profit ($35) ($28) ($24) ($26) ($5) $51 $175 $392 % margin 22% 37% 43% (+) D&A 11 13 5 8 11 16 22 33 Adj. EBITDA ($23) ($15) ($18) ($18) $6 $66 $198 $425 % margin 5% 29% 41% 47% (-) Capex (12) (9) (10) (16) (20) (25) (31) (68) Free Cash Flow (FCF) ($35) ($24) ($29) ($34) ($14) $41 $166 $357 % FCF conversion 62% 84% 84% Source: 2021 – 2025 Spire financials based on management projections Note: This slide contains non-GAAP financial measures and key metrics relating to Spire’s past and expected future performance. For historical periods, you can find the reconciliation of these measures to the most directly comparable GAAP financial measure in the Appendix at the end of this presentation. The non-GAAP financial measures disclosed in this presentation should not be considered a substitute for, or superior to, the financial measures prepared in accordance with GAAP 28 2020P financials are unaudited. Our audited financial statements for our year ended December 31, 2020 are not yet available. Accordingly, the 2020 financial results are preliminary and subject to the completion of our financial closing procedures and any adjustments that may result from the completion of the audits of our financial statements. As a result, these preliminary results may differ from the actual results that will be reflected in our financial statements when they are completed and publicly disclosed. These preliminary results may change and any change may be material FCF conversion defined as (Adj. EBITDA – Capex) / Adj. EBITDASPIRE NON-GAAP FINANCIAL SUMMARY ($ in millions) FY 12/31 2018A 2019A 2020P 2021E 2022E 2023E 2024E 2025E ASP for ARR (in thousands) $262 $208 $235 $258 $310 $332 $370 $396 Total GAAP Revenue $6 $18 $28 $54 $114 $227 $478 $913 % growth 203% 54% 89% 112% 99% 111% 91% Gross Profit ($9) $4 $18 $35 $84 $186 $422 $830 % margin NM 20% 63% 66% 74% 82% 88% 91% (-) Research & Development ($12) ($17) ($20) ($28) ($40) ($55) ($96) ($146) (-) Sales & Marketing (4) (5) (10) (19) (32) (58) (105) (201) (-) General and Administrative (9) (10) (12) (14) (18) (23) (45) (91) Operating Profit ($35) ($28) ($24) ($26) ($5) $51 $175 $392 % margin 22% 37% 43% (+) D&A 11 13 5 8 11 16 22 33 Adj. EBITDA ($23) ($15) ($18) ($18) $6 $66 $198 $425 % margin 5% 29% 41% 47% (-) Capex (12) (9) (10) (16) (20) (25) (31) (68) Free Cash Flow (FCF) ($35) ($24) ($29) ($34) ($14) $41 $166 $357 % FCF conversion 62% 84% 84% Source: 2021 – 2025 Spire financials based on management projections Note: This slide contains non-GAAP financial measures and key metrics relating to Spire’s past and expected future performance. For historical periods, you can find the reconciliation of these measures to the most directly comparable GAAP financial measure in the Appendix at the end of this presentation. The non-GAAP financial measures disclosed in this presentation should not be considered a substitute for, or superior to, the financial measures prepared in accordance with GAAP 28 2020P financials are unaudited. Our audited financial statements for our year ended December 31, 2020 are not yet available. Accordingly, the 2020 financial results are preliminary and subject to the completion of our financial closing procedures and any adjustments that may result from the completion of the audits of our financial statements. As a result, these preliminary results may differ from the actual results that will be reflected in our financial statements when they are completed and publicly disclosed. These preliminary results may change and any change may be material FCF conversion defined as (Adj. EBITDA – Capex) / Adj. EBITDA

TRANSACTION & VALUATION OVERVIEW TRANSACTION & VALUATION OVERVIEW
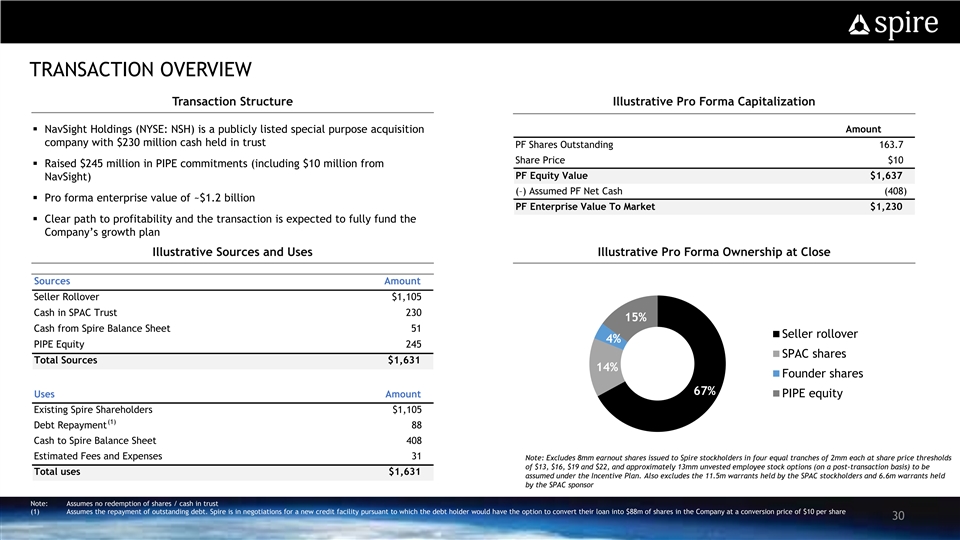
TRANSACTION OVERVIEW DISCLAIMER AND FORWARD LOOKING STATEMENTS Transaction Structure Illustrative Pro Forma Capitalization § NavSight Holdings (NYSE: NSH) is a publicly listed special purpose acquisition Amount company with $230 million cash held in trust PF Shares Outstanding 163.7 Share Price $10 § Raised $245 million in PIPE commitments (including $10 million from PF Equity Value $1,637 NavSight) (–) Assumed PF Net Cash (408) § Pro forma enterprise value of ~$1.2 billion PF Enterprise Value To Market $1,230 § Clear path to profitability and the transaction is expected to fully fund the Company’s growth plan Illustrative Sources and Uses Illustrative Pro Forma Ownership at Close Sources Amount Seller Rollover $1,105 Cash in SPAC Trust 230 15% Cash from Spire Balance Sheet 51 Seller rollover 4% PIPE Equity 245 SPAC shares Total Sources $1,631 14% Founder shares 67% PIPE equity Uses Amount Existing Spire Shareholders $1,105 (1) Debt Repayment 88 Cash to Spire Balance Sheet 408 Estimated Fees and Expenses 31 Note: Excludes 8mm earnout shares issued to Spire stockholders in four equal tranches of 2mm each at share price thresholds of $13, $16, $19 and $22, and approximately 13mm unvested employee stock options (on a post-transaction basis) to be Total uses $1,631 assumed under the Incentive Plan. Also excludes the 11.5m warrants held by the SPAC stockholders and 6.6m warrants held by the SPAC sponsor Note: Assumes no redemption of shares / cash in trust (1) Assumes the repayment of outstanding debt. Spire is in negotiations for a new credit facility pursuant to which the debt holder would have the option to convert their loan into $88m of shares in the Company at a conversion price of $10 per share 30TRANSACTION OVERVIEW DISCLAIMER AND FORWARD LOOKING STATEMENTS Transaction Structure Illustrative Pro Forma Capitalization § NavSight Holdings (NYSE: NSH) is a publicly listed special purpose acquisition Amount company with $230 million cash held in trust PF Shares Outstanding 163.7 Share Price $10 § Raised $245 million in PIPE commitments (including $10 million from PF Equity Value $1,637 NavSight) (–) Assumed PF Net Cash (408) § Pro forma enterprise value of ~$1.2 billion PF Enterprise Value To Market $1,230 § Clear path to profitability and the transaction is expected to fully fund the Company’s growth plan Illustrative Sources and Uses Illustrative Pro Forma Ownership at Close Sources Amount Seller Rollover $1,105 Cash in SPAC Trust 230 15% Cash from Spire Balance Sheet 51 Seller rollover 4% PIPE Equity 245 SPAC shares Total Sources $1,631 14% Founder shares 67% PIPE equity Uses Amount Existing Spire Shareholders $1,105 (1) Debt Repayment 88 Cash to Spire Balance Sheet 408 Estimated Fees and Expenses 31 Note: Excludes 8mm earnout shares issued to Spire stockholders in four equal tranches of 2mm each at share price thresholds of $13, $16, $19 and $22, and approximately 13mm unvested employee stock options (on a post-transaction basis) to be Total uses $1,631 assumed under the Incentive Plan. Also excludes the 11.5m warrants held by the SPAC stockholders and 6.6m warrants held by the SPAC sponsor Note: Assumes no redemption of shares / cash in trust (1) Assumes the repayment of outstanding debt. Spire is in negotiations for a new credit facility pursuant to which the debt holder would have the option to convert their loan into $88m of shares in the Company at a conversion price of $10 per share 30
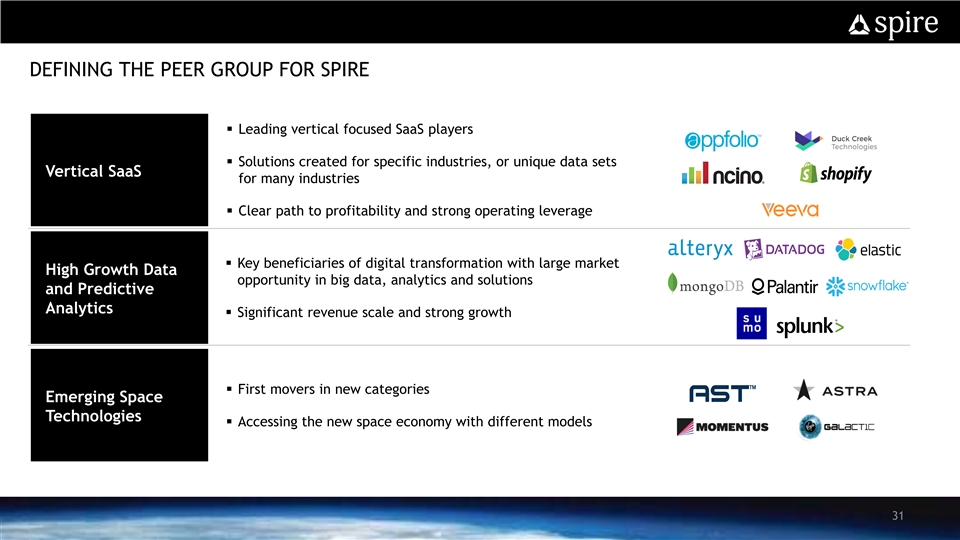
DEFINING THE PEER GROUP FOR SPIRE § Leading vertical focused SaaS players § Solutions created for specific industries, or unique data sets Vertical SaaS for many industries § Clear path to profitability and strong operating leverage § Key beneficiaries of digital transformation with large market High Growth Data opportunity in big data, analytics and solutions and Predictive Analytics § Significant revenue scale and strong growth § First movers in new categories Emerging Space Technologies § Accessing the new space economy with different models 31DEFINING THE PEER GROUP FOR SPIRE § Leading vertical focused SaaS players § Solutions created for specific industries, or unique data sets Vertical SaaS for many industries § Clear path to profitability and strong operating leverage § Key beneficiaries of digital transformation with large market High Growth Data opportunity in big data, analytics and solutions and Predictive Analytics § Significant revenue scale and strong growth § First movers in new categories Emerging Space Technologies § Accessing the new space economy with different models 31
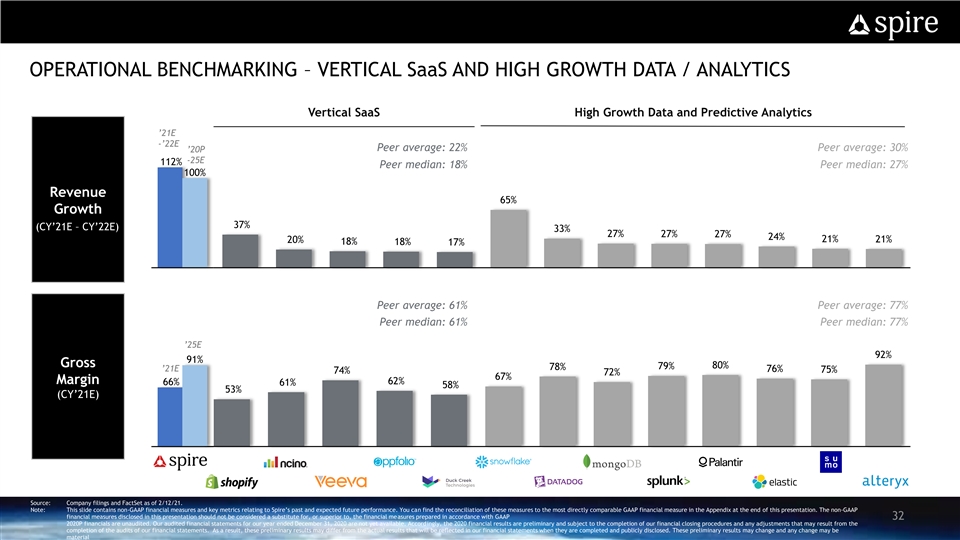
OPERATIONAL BENCHMARKING – VERTICAL SaaS AND HIGH GROWTH DATA / ANALYTICS Vertical SaaS High Growth Data and Predictive Analytics ’21E -’22E Peer average: 22% Peer average: 30% ’20P -25E 112% Peer median: 18% Peer median: 27% 100% Revenue 65% Growth 37% (CY’21E – CY’22E) 33% 27% 27% 27% 24% 21% 20% 21% 18% 18% 17% Peer average: 61% Peer average: 77% Peer median: 61% Peer median: 77% ’25E 92% 91% Gross 79% 80% 78% ’21E 76% 75% 74% 72% 67% Margin 62% 66% 61% 58% 53% (CY’21E) Source: Company filings and FactSet as of 2/12/21. Note: This slide contains non-GAAP financial measures and key metrics relating to Spire’s past and expected future performance. You can find the reconciliation of these measures to the most directly comparable GAAP financial measure in the Appendix at the end of this presentation. The non-GAAP financial measures disclosed in this presentation should not be considered a substitute for, or superior to, the financial measures prepared in accordance with GAAP 32 2020P financials are unaudited. Our audited financial statements for our year ended December 31, 2020 are not yet available. Accordingly, the 2020 financial results are preliminary and subject to the completion of our financial closing procedures and any adjustments that may result from the completion of the audits of our financial statements. As a result, these preliminary results may differ from the actual results that will be reflected in our financial statements when they are completed and publicly disclosed. These preliminary results may change and any change may be materialOPERATIONAL BENCHMARKING – VERTICAL SaaS AND HIGH GROWTH DATA / ANALYTICS Vertical SaaS High Growth Data and Predictive Analytics ’21E -’22E Peer average: 22% Peer average: 30% ’20P -25E 112% Peer median: 18% Peer median: 27% 100% Revenue 65% Growth 37% (CY’21E – CY’22E) 33% 27% 27% 27% 24% 21% 20% 21% 18% 18% 17% Peer average: 61% Peer average: 77% Peer median: 61% Peer median: 77% ’25E 92% 91% Gross 79% 80% 78% ’21E 76% 75% 74% 72% 67% Margin 62% 66% 61% 58% 53% (CY’21E) Source: Company filings and FactSet as of 2/12/21. Note: This slide contains non-GAAP financial measures and key metrics relating to Spire’s past and expected future performance. You can find the reconciliation of these measures to the most directly comparable GAAP financial measure in the Appendix at the end of this presentation. The non-GAAP financial measures disclosed in this presentation should not be considered a substitute for, or superior to, the financial measures prepared in accordance with GAAP 32 2020P financials are unaudited. Our audited financial statements for our year ended December 31, 2020 are not yet available. Accordingly, the 2020 financial results are preliminary and subject to the completion of our financial closing procedures and any adjustments that may result from the completion of the audits of our financial statements. As a result, these preliminary results may differ from the actual results that will be reflected in our financial statements when they are completed and publicly disclosed. These preliminary results may change and any change may be material
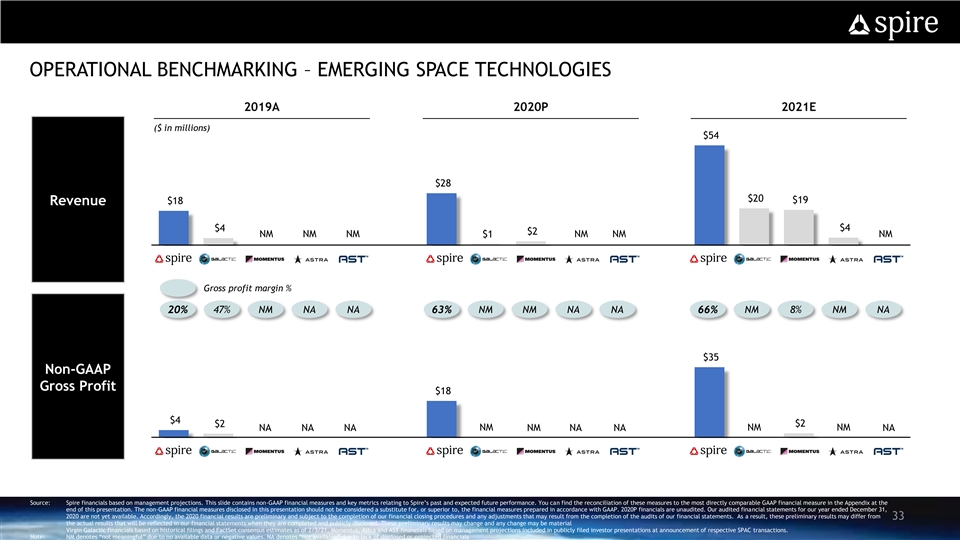
OPERATIONAL BENCHMARKING – EMERGING SPACE TECHNOLOGIES DISCLAIMER AND FORWARD LOOKING STATEMENTS 2019A 2020P 2021E ($ in millions) $54 $28 $20 $19 $18 Revenue $4 $4 $2 NM NM NM NM NM NM $1 Gross profit margin % 20% 47% NM NA NA 63% NM NM NA NA 66% NM 8% NM NA $35 Non-GAAP Gross Profit $18 $4 $2 $2 NA NM NA NA NM NM NM NM NA NM NA NM NM NM NA Source: Spire financials based on management projections. This slide contains non-GAAP financial measures and key metrics relating to Spire’s past and expected future performance. You can find the reconciliation of these measures to the most directly comparable GAAP financial measure in the Appendix at the end of this presentation. The non-GAAP financial measures disclosed in this presentation should not be considered a substitute for, or superior to, the financial measures prepared in accordance with GAAP. 2020P financials are unaudited. Our audited financial statements for our year ended December 31, 2020 are not yet available. Accordingly, the 2020 financial results are preliminary and subject to the completion of our financial closing procedures and any adjustments that may result from the completion of the audits of our financial statements. As a result, these preliminary results may differ from 33 the actual results that will be reflected in our financial statements when they are completed and publicly disclosed. These preliminary results may change and any change may be material Virgin Galactic financials based on historical filings and FactSet consensus estimates as of 2/3/21. Momentus, Astra and AST financials based on management projections included in publicly filed investor presentations at announcement of respective SPAC transactions. Note: NM denotes “not meaningful” due to no available data or negative values. NA denotes “not available” due to lack of disclosed or projected financialsOPERATIONAL BENCHMARKING – EMERGING SPACE TECHNOLOGIES DISCLAIMER AND FORWARD LOOKING STATEMENTS 2019A 2020P 2021E ($ in millions) $54 $28 $20 $19 $18 Revenue $4 $4 $2 NM NM NM NM NM NM $1 Gross profit margin % 20% 47% NM NA NA 63% NM NM NA NA 66% NM 8% NM NA $35 Non-GAAP Gross Profit $18 $4 $2 $2 NA NM NA NA NM NM NM NM NA NM NA NM NM NM NA Source: Spire financials based on management projections. This slide contains non-GAAP financial measures and key metrics relating to Spire’s past and expected future performance. You can find the reconciliation of these measures to the most directly comparable GAAP financial measure in the Appendix at the end of this presentation. The non-GAAP financial measures disclosed in this presentation should not be considered a substitute for, or superior to, the financial measures prepared in accordance with GAAP. 2020P financials are unaudited. Our audited financial statements for our year ended December 31, 2020 are not yet available. Accordingly, the 2020 financial results are preliminary and subject to the completion of our financial closing procedures and any adjustments that may result from the completion of the audits of our financial statements. As a result, these preliminary results may differ from 33 the actual results that will be reflected in our financial statements when they are completed and publicly disclosed. These preliminary results may change and any change may be material Virgin Galactic financials based on historical filings and FactSet consensus estimates as of 2/3/21. Momentus, Astra and AST financials based on management projections included in publicly filed investor presentations at announcement of respective SPAC transactions. Note: NM denotes “not meaningful” due to no available data or negative values. NA denotes “not available” due to lack of disclosed or projected financials
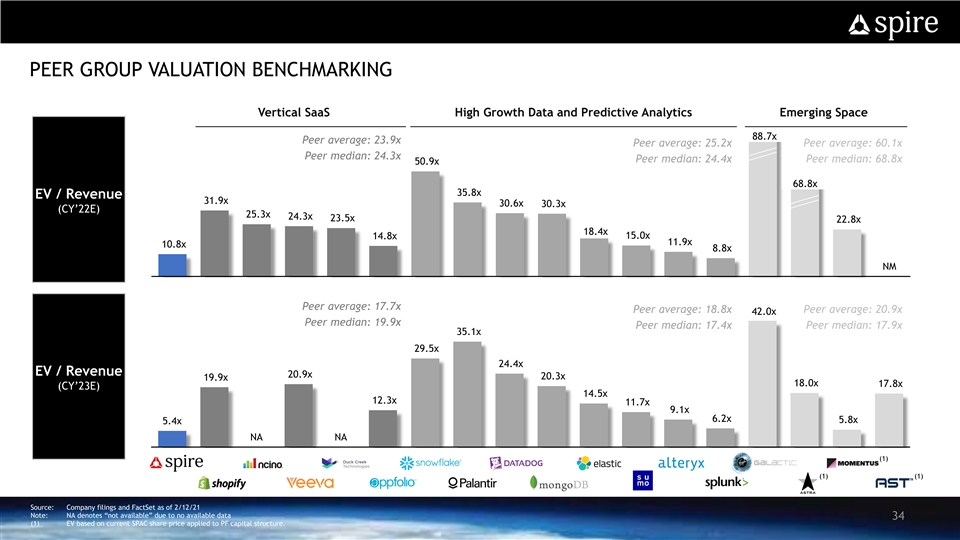
PEER GROUP VALUATION BENCHMARKING Vertical SaaS High Growth Data and Predictive Analytics Emerging Space 68.8x 88.7x Peer average: 23.9x Peer average: 25.2x Peer average: 60.1x Peer median: 24.3x Peer median: 24.4x Peer median: 68.8x 50.9x 68.8x 35.8x EV / Revenue 31.9x 30.6x 30.3x (CY’22E) 25.3x 24.3x 23.5x 22.8x 18.4x 14.8x 15.0x 11.9x 10.8x 8.8x NM Peer average: 17.7x Peer average: 18.8x Peer average: 20.9x 42.0x Peer median: 19.9x Peer median: 17.4x Peer median: 17.9x 35.1x 29.5x 24.4x EV / Revenue 20.9x 20.3x 19.9x 18.0x 17.8x (CY’23E) 14.5x 12.3x 11.7x 9.1x 6.2x 5.8x 5.4x NA NA (1) (1) (1) Source: Company filings and FactSet as of 2/12/21 Note: NA denotes “not available” due to no available data 34 (1) EV based on current SPAC share price applied to PF capital structure.PEER GROUP VALUATION BENCHMARKING Vertical SaaS High Growth Data and Predictive Analytics Emerging Space 68.8x 88.7x Peer average: 23.9x Peer average: 25.2x Peer average: 60.1x Peer median: 24.3x Peer median: 24.4x Peer median: 68.8x 50.9x 68.8x 35.8x EV / Revenue 31.9x 30.6x 30.3x (CY’22E) 25.3x 24.3x 23.5x 22.8x 18.4x 14.8x 15.0x 11.9x 10.8x 8.8x NM Peer average: 17.7x Peer average: 18.8x Peer average: 20.9x 42.0x Peer median: 19.9x Peer median: 17.4x Peer median: 17.9x 35.1x 29.5x 24.4x EV / Revenue 20.9x 20.3x 19.9x 18.0x 17.8x (CY’23E) 14.5x 12.3x 11.7x 9.1x 6.2x 5.8x 5.4x NA NA (1) (1) (1) Source: Company filings and FactSet as of 2/12/21 Note: NA denotes “not available” due to no available data 34 (1) EV based on current SPAC share price applied to PF capital structure.
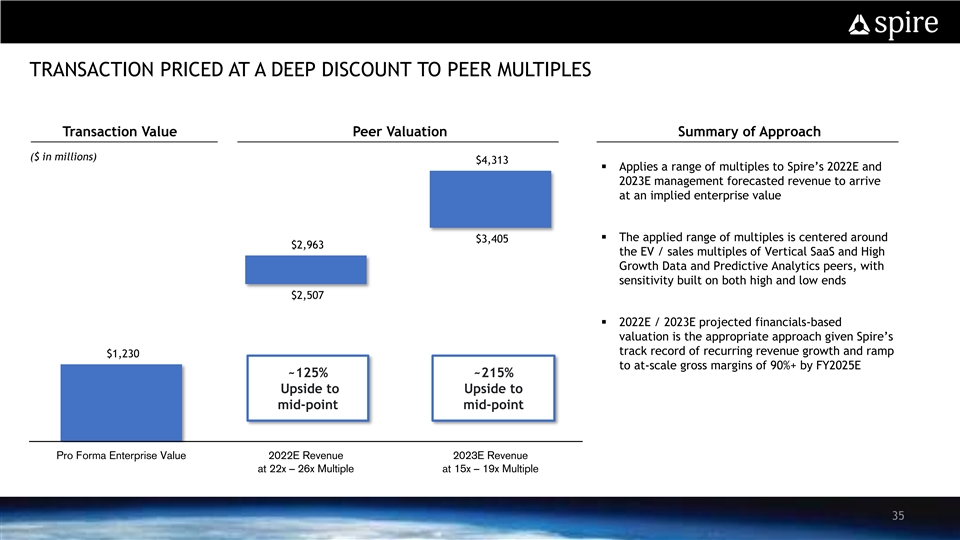
TRANSACTION PRICED AT A DEEP DISCOUNT TO PEER MULTIPLES Transaction Value Peer Valuation Summary of Approach ($ in millions) $4,313 § Applies a range of multiples to Spire’s 2022E and 2023E management forecasted revenue to arrive at an implied enterprise value § The applied range of multiples is centered around $3,405 $2,963 the EV / sales multiples of Vertical SaaS and High Growth Data and Predictive Analytics peers, with sensitivity built on both high and low ends $2,507 § 2022E / 2023E projected financials-based valuation is the appropriate approach given Spire’s track record of recurring revenue growth and ramp $1,230 to at-scale gross margins of 90%+ by FY2025E ~125% ~215% Upside to Upside to mid-point mid-point Pro Forma Enterprise Value 2022E Revenue 2023E Revenue at 22x – 26x Multiple at 15x – 19x Multiple 35TRANSACTION PRICED AT A DEEP DISCOUNT TO PEER MULTIPLES Transaction Value Peer Valuation Summary of Approach ($ in millions) $4,313 § Applies a range of multiples to Spire’s 2022E and 2023E management forecasted revenue to arrive at an implied enterprise value § The applied range of multiples is centered around $3,405 $2,963 the EV / sales multiples of Vertical SaaS and High Growth Data and Predictive Analytics peers, with sensitivity built on both high and low ends $2,507 § 2022E / 2023E projected financials-based valuation is the appropriate approach given Spire’s track record of recurring revenue growth and ramp $1,230 to at-scale gross margins of 90%+ by FY2025E ~125% ~215% Upside to Upside to mid-point mid-point Pro Forma Enterprise Value 2022E Revenue 2023E Revenue at 22x – 26x Multiple at 15x – 19x Multiple 35

APPENDIXAPPENDIX
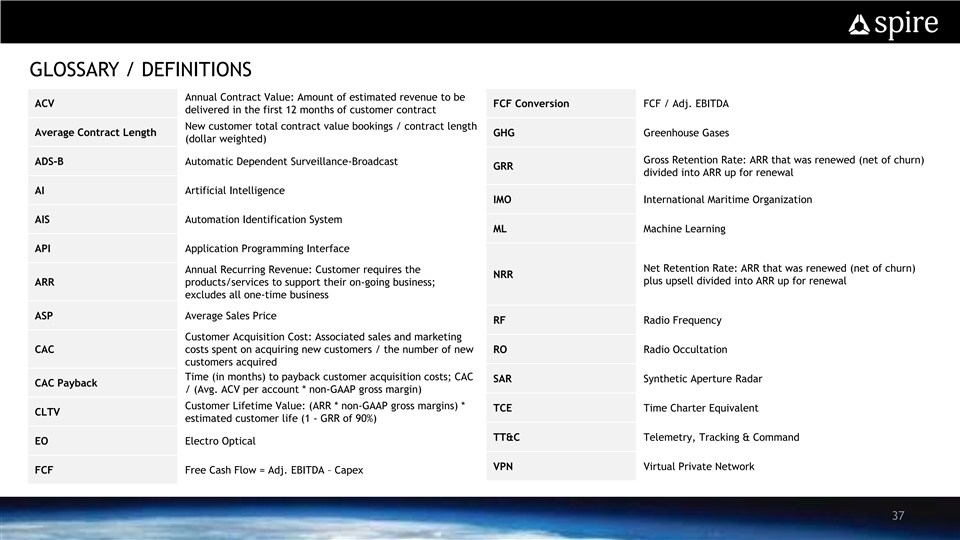
GLOSSARY / DEFINITIONS Annual Contract Value: Amount of estimated revenue to be ACV FCF Conversion FCF / Adj. EBITDA delivered in the first 12 months of customer contract New customer total contract value bookings / contract length Average Contract Length GHG Greenhouse Gases (dollar weighted) Gross Retention Rate: ARR that was renewed (net of churn) ADS-B Automatic Dependent Surveillance-Broadcast GRR divided into ARR up for renewal AI Artificial Intelligence IMO International Maritime Organization AIS Automation Identification System ML Machine Learning API Application Programming Interface Net Retention Rate: ARR that was renewed (net of churn) Annual Recurring Revenue: Customer requires the NRR plus upsell divided into ARR up for renewal ARR products/services to support their on-going business; excludes all one-time business ASP Average Sales Price RF Radio Frequency Customer Acquisition Cost: Associated sales and marketing CAC costs spent on acquiring new customers / the number of new RO Radio Occultation customers acquired Time (in months) to payback customer acquisition costs; CAC SAR Synthetic Aperture Radar CAC Payback / (Avg. ACV per account * non-GAAP gross margin) Customer Lifetime Value: (ARR * non-GAAP gross margins) * TCE Time Charter Equivalent CLTV estimated customer life (1 - GRR of 90%) TT&C Telemetry, Tracking & Command EO Electro Optical VPN Virtual Private Network FCF Free Cash Flow = Adj. EBITDA – Capex 37GLOSSARY / DEFINITIONS Annual Contract Value: Amount of estimated revenue to be ACV FCF Conversion FCF / Adj. EBITDA delivered in the first 12 months of customer contract New customer total contract value bookings / contract length Average Contract Length GHG Greenhouse Gases (dollar weighted) Gross Retention Rate: ARR that was renewed (net of churn) ADS-B Automatic Dependent Surveillance-Broadcast GRR divided into ARR up for renewal AI Artificial Intelligence IMO International Maritime Organization AIS Automation Identification System ML Machine Learning API Application Programming Interface Net Retention Rate: ARR that was renewed (net of churn) Annual Recurring Revenue: Customer requires the NRR plus upsell divided into ARR up for renewal ARR products/services to support their on-going business; excludes all one-time business ASP Average Sales Price RF Radio Frequency Customer Acquisition Cost: Associated sales and marketing CAC costs spent on acquiring new customers / the number of new RO Radio Occultation customers acquired Time (in months) to payback customer acquisition costs; CAC SAR Synthetic Aperture Radar CAC Payback / (Avg. ACV per account * non-GAAP gross margin) Customer Lifetime Value: (ARR * non-GAAP gross margins) * TCE Time Charter Equivalent CLTV estimated customer life (1 - GRR of 90%) TT&C Telemetry, Tracking & Command EO Electro Optical VPN Virtual Private Network FCF Free Cash Flow = Adj. EBITDA – Capex 37
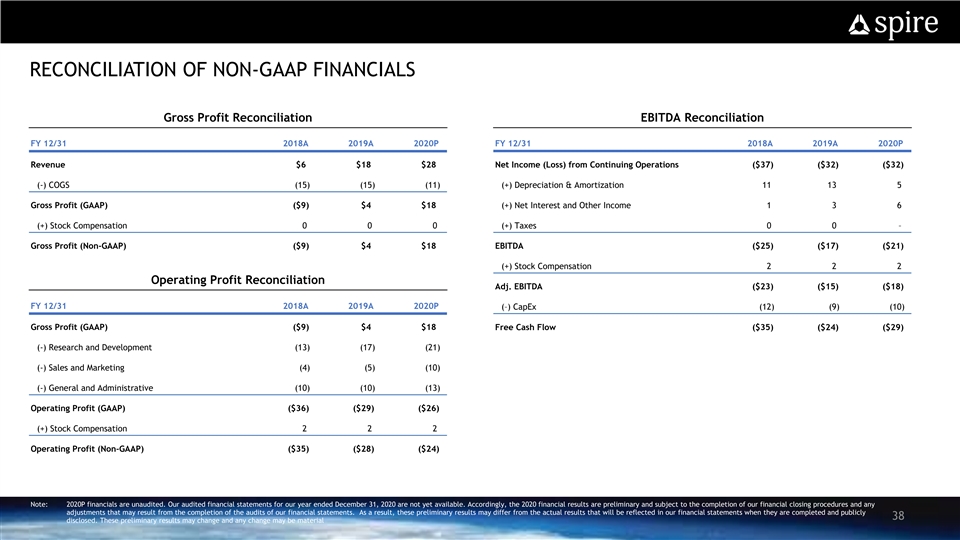
RECONCILIATION OF NON-GAAP FINANCIALS Gross Profit Reconciliation EBITDA Reconciliation FY 12/31 2018A 2019A 2020P FY 12/31 2018A 2019A 2020P Revenue $6 $18 $28 Net Income (Loss) from Continuing Operations ($37) ($32) ($32) (-) COGS (15) (15) (11) (+) Depreciation & Amortization 11 13 5 Gross Profit (GAAP) ($9) $4 $18 (+) Net Interest and Other Income 1 3 6 (+) Stock Compensation 0 0 0 (+) Taxes 0 0 – Gross Profit (Non-GAAP) ($9) $4 $18 EBITDA ($25) ($17) ($21) (+) Stock Compensation 2 2 2 Operating Profit Reconciliation Adj. EBITDA ($23) ($15) ($18) FY 12/31 2018A 2019A 2020P (–) CapEx (12) (9) (10) Gross Profit (GAAP) ($9) $4 $18 Free Cash Flow ($35) ($24) ($29) (-) Research and Development (13) (17) (21) (-) Sales and Marketing (4) (5) (10) (-) General and Administrative (10) (10) (13) Operating Profit (GAAP) ($36) ($29) ($26) (+) Stock Compensation 2 2 2 Operating Profit (Non-GAAP) ($35) ($28) ($24) Note: 2020P financials are unaudited. Our audited financial statements for our year ended December 31, 2020 are not yet available. Accordingly, the 2020 financial results are preliminary and subject to the completion of our financial closing procedures and any adjustments that may result from the completion of the audits of our financial statements. As a result, these preliminary results may differ from the actual results that will be reflected in our financial statements when they are completed and publicly 38 disclosed. These preliminary results may change and any change may be material RECONCILIATION OF NON-GAAP FINANCIALS Gross Profit Reconciliation EBITDA Reconciliation FY 12/31 2018A 2019A 2020P FY 12/31 2018A 2019A 2020P Revenue $6 $18 $28 Net Income (Loss) from Continuing Operations ($37) ($32) ($32) (-) COGS (15) (15) (11) (+) Depreciation & Amortization 11 13 5 Gross Profit (GAAP) ($9) $4 $18 (+) Net Interest and Other Income 1 3 6 (+) Stock Compensation 0 0 0 (+) Taxes 0 0 – Gross Profit (Non-GAAP) ($9) $4 $18 EBITDA ($25) ($17) ($21) (+) Stock Compensation 2 2 2 Operating Profit Reconciliation Adj. EBITDA ($23) ($15) ($18) FY 12/31 2018A 2019A 2020P (–) CapEx (12) (9) (10) Gross Profit (GAAP) ($9) $4 $18 Free Cash Flow ($35) ($24) ($29) (-) Research and Development (13) (17) (21) (-) Sales and Marketing (4) (5) (10) (-) General and Administrative (10) (10) (13) Operating Profit (GAAP) ($36) ($29) ($26) (+) Stock Compensation 2 2 2 Operating Profit (Non-GAAP) ($35) ($28) ($24) Note: 2020P financials are unaudited. Our audited financial statements for our year ended December 31, 2020 are not yet available. Accordingly, the 2020 financial results are preliminary and subject to the completion of our financial closing procedures and any adjustments that may result from the completion of the audits of our financial statements. As a result, these preliminary results may differ from the actual results that will be reflected in our financial statements when they are completed and publicly 38 disclosed. These preliminary results may change and any change may be material
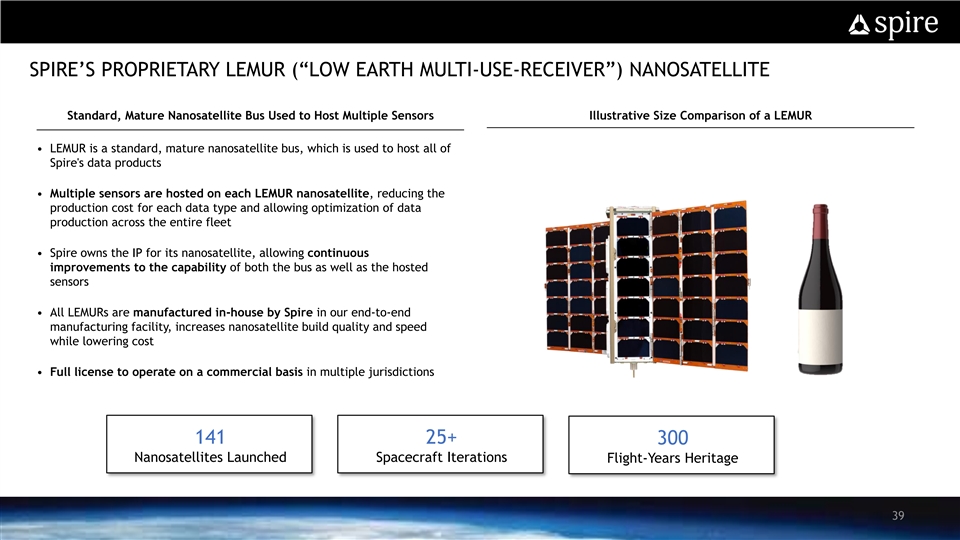
SPIRE’S PROPRIETARY LEMUR (“LOW EARTH MULTI-USE-RECEIVER”) NANOSATELLITE Standard, Mature Nanosatellite Bus Used to Host Multiple Sensors Illustrative Size Comparison of a LEMUR • LEMUR is a standard, mature nanosatellite bus, which is used to host all of Spire's data products • Multiple sensors are hosted on each LEMUR nanosatellite, reducing the production cost for each data type and allowing optimization of data production across the entire fleet • Spire owns the IP for its nanosatellite, allowing continuous improvements to the capability of both the bus as well as the hosted sensors • All LEMURs are manufactured in-house by Spire in our end-to-end manufacturing facility, increases nanosatellite build quality and speed while lowering cost • Full license to operate on a commercial basis in multiple jurisdictions 141 25+ 300 Nanosatellites Launched Spacecraft Iterations Flight-Years Heritage 39SPIRE’S PROPRIETARY LEMUR (“LOW EARTH MULTI-USE-RECEIVER”) NANOSATELLITE Standard, Mature Nanosatellite Bus Used to Host Multiple Sensors Illustrative Size Comparison of a LEMUR • LEMUR is a standard, mature nanosatellite bus, which is used to host all of Spire's data products • Multiple sensors are hosted on each LEMUR nanosatellite, reducing the production cost for each data type and allowing optimization of data production across the entire fleet • Spire owns the IP for its nanosatellite, allowing continuous improvements to the capability of both the bus as well as the hosted sensors • All LEMURs are manufactured in-house by Spire in our end-to-end manufacturing facility, increases nanosatellite build quality and speed while lowering cost • Full license to operate on a commercial basis in multiple jurisdictions 141 25+ 300 Nanosatellites Launched Spacecraft Iterations Flight-Years Heritage 39
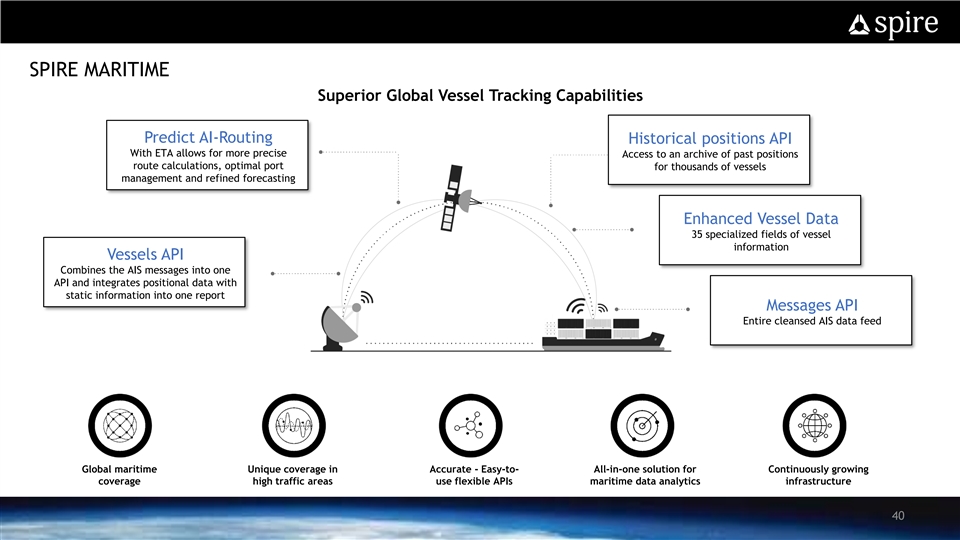
SPIRE MARITIME Superior Global Vessel Tracking Capabilities Predict AI-Routing Historical positions API With ETA allows for more precise Access to an archive of past positions route calculations, optimal port for thousands of vessels management and refined forecasting Enhanced Vessel Data 35 specialized fields of vessel information Vessels API Combines the AIS messages into one API and integrates positional data with static information into one report Messages API Entire cleansed AIS data feed Global maritime Unique coverage in Accurate - Easy-to- All-in-one solution for Continuously growing coverage high traffic areas use flexible APIs maritime data analytics infrastructure 40SPIRE MARITIME Superior Global Vessel Tracking Capabilities Predict AI-Routing Historical positions API With ETA allows for more precise Access to an archive of past positions route calculations, optimal port for thousands of vessels management and refined forecasting Enhanced Vessel Data 35 specialized fields of vessel information Vessels API Combines the AIS messages into one API and integrates positional data with static information into one report Messages API Entire cleansed AIS data feed Global maritime Unique coverage in Accurate - Easy-to- All-in-one solution for Continuously growing coverage high traffic areas use flexible APIs maritime data analytics infrastructure 40
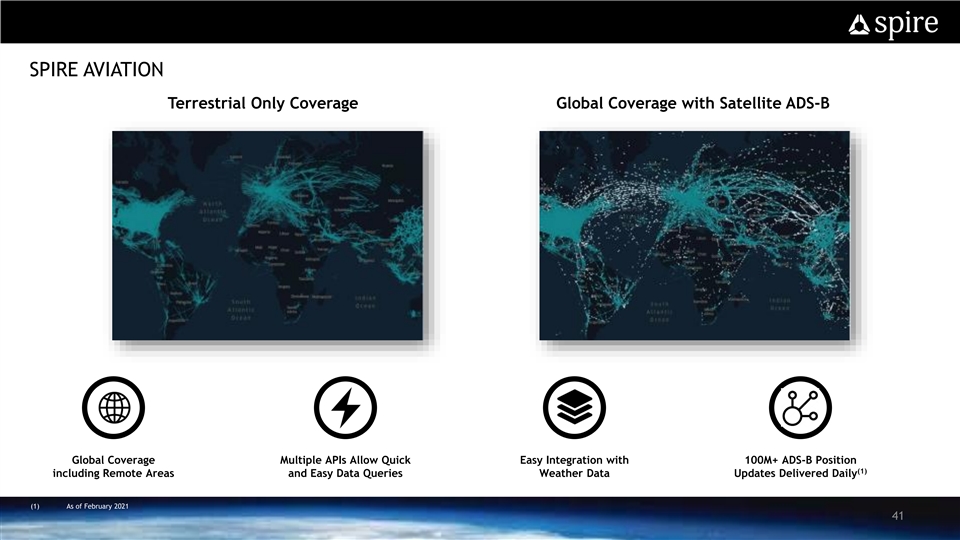
SPIRE AVIATION Terrestrial Only Coverage Global Coverage with Satellite ADS-B Global Coverage Multiple APIs Allow Quick Easy Integration with 100M+ ADS-B Position (1) including Remote Areas and Easy Data Queries Weather Data Updates Delivered Daily (1) As of February 2021 41SPIRE AVIATION Terrestrial Only Coverage Global Coverage with Satellite ADS-B Global Coverage Multiple APIs Allow Quick Easy Integration with 100M+ ADS-B Position (1) including Remote Areas and Easy Data Queries Weather Data Updates Delivered Daily (1) As of February 2021 41
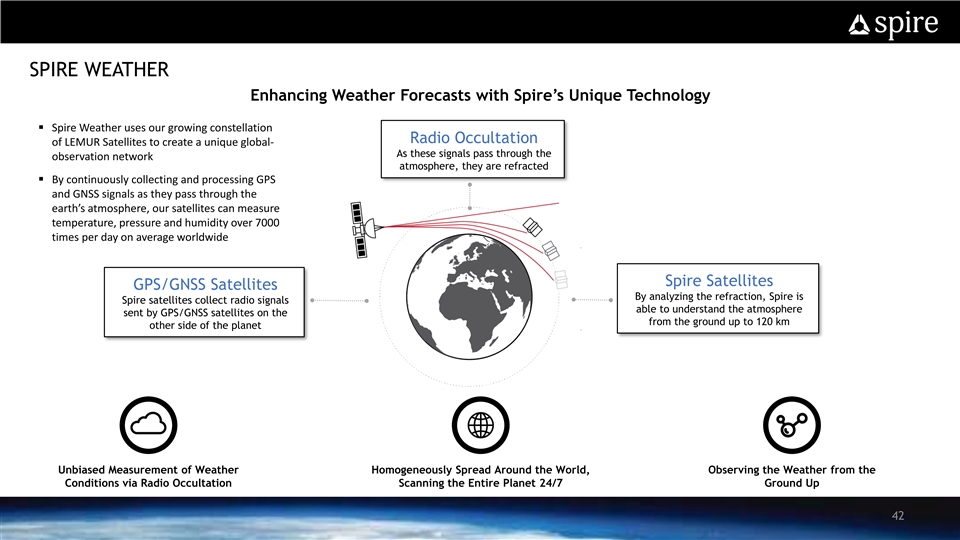
SPIRE WEATHER Enhancing Weather Forecasts with Spire’s Unique Technology § Spire Weather uses our growing constellation Radio Occultation of LEMUR Satellites to create a unique global- As these signals pass through the observation network atmosphere, they are refracted § By continuously collecting and processing GPS and GNSS signals as they pass through the earth’s atmosphere, our satellites can measure temperature, pressure and humidity over 7000 times per day on average worldwide Spire Satellites GPS/GNSS Satellites By analyzing the refraction, Spire is Spire satellites collect radio signals able to understand the atmosphere sent by GPS/GNSS satellites on the from the ground up to 120 km other side of the planet Unbiased Measurement of Weather Homogeneously Spread Around the World, Observing the Weather from the Conditions via Radio Occultation Scanning the Entire Planet 24/7 Ground Up 42SPIRE WEATHER Enhancing Weather Forecasts with Spire’s Unique Technology § Spire Weather uses our growing constellation Radio Occultation of LEMUR Satellites to create a unique global- As these signals pass through the observation network atmosphere, they are refracted § By continuously collecting and processing GPS and GNSS signals as they pass through the earth’s atmosphere, our satellites can measure temperature, pressure and humidity over 7000 times per day on average worldwide Spire Satellites GPS/GNSS Satellites By analyzing the refraction, Spire is Spire satellites collect radio signals able to understand the atmosphere sent by GPS/GNSS satellites on the from the ground up to 120 km other side of the planet Unbiased Measurement of Weather Homogeneously Spread Around the World, Observing the Weather from the Conditions via Radio Occultation Scanning the Entire Planet 24/7 Ground Up 42
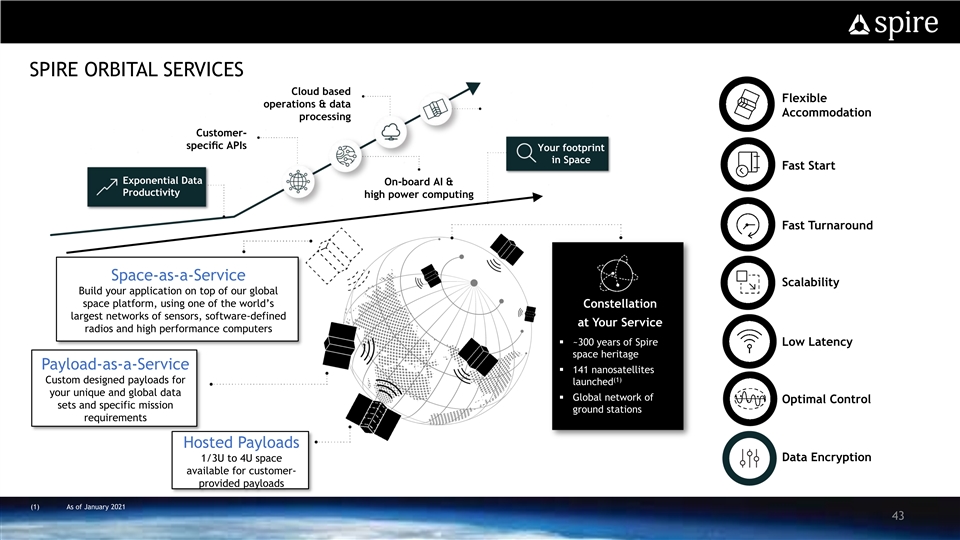
SPIRE ORBITAL SERVICES Cloud based Flexible operations & data Accommodation processing Customer- specific APIs Your footprint in Space Fast Start Exponential Data On-board AI & Productivity high power computing Fast Turnaround Space-as-a-Service Scalability Build your application on top of our global space platform, using one of the world’s Constellation largest networks of sensors, software-defined at Your Service radios and high performance computers § ~300 years of Spire Low Latency space heritage Payload-as-a-Service § 141 nanosatellites (1) Custom designed payloads for launched your unique and global data § Global network of Optimal Control sets and specific mission ground stations requirements Hosted Payloads Data Encryption 1/3U to 4U space available for customer- provided payloads (1) As of January 2021 43SPIRE ORBITAL SERVICES Cloud based Flexible operations & data Accommodation processing Customer- specific APIs Your footprint in Space Fast Start Exponential Data On-board AI & Productivity high power computing Fast Turnaround Space-as-a-Service Scalability Build your application on top of our global space platform, using one of the world’s Constellation largest networks of sensors, software-defined at Your Service radios and high performance computers § ~300 years of Spire Low Latency space heritage Payload-as-a-Service § 141 nanosatellites (1) Custom designed payloads for launched your unique and global data § Global network of Optimal Control sets and specific mission ground stations requirements Hosted Payloads Data Encryption 1/3U to 4U space available for customer- provided payloads (1) As of January 2021 43